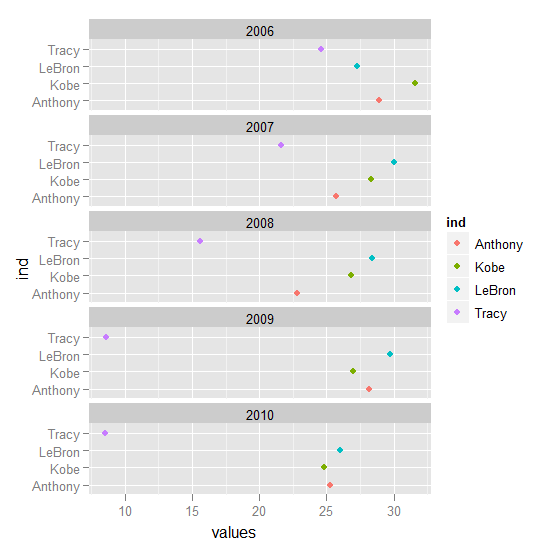
I am replicating a version of this dotplot http://blogs.bgsu.edu/math6820cwenren/files/2011/04/ggplot-dotplot.png from http://blogs.bgsu.edu/math6820cwenren/2011/04/27/ggplot2/. Code is below.
I would like the plot and the key to match in the order of presentation. This could be accomplished by reordering the variable ind to appear as in the plot, i.e., Tracy, LeBron, Kobe, Anthony. Or vice-versa and reorder the key. I've tried reordering the factors with several methods but the order in key is always reverse the order in the plot.
How to reorder so the presentation is consistent?
Kobe=c(31.6, 28.3, 26.8, 27.0, 24.8)
LeBron=c(27.3, 30.0, 28.4, 29.7, 26.0)
Tracy=c(24.6, 21.6, 15.6, 8.6, 8.5)
Anthony=c(28.9, 25.7, 22.8, 28.2, 25.3)
year=c(2006, 2007, 2008, 2009, 2010)

data1=cbind(Kobe, LeBron, Tracy, Anthony)

data=data.frame(data1,row.names=year)

d=data.frame(Year=dimnames(data)[[1]],stack(data))

p=ggplot(d, aes(values, ind, color=ind))
p + geom_point()+ facet_wrap(~Year, ncol=1)
