I want to do the opposite of this question, and sort of the opposite of this question, though that's about legends, not the plot itself.
The other SO questions seem to be asking about how to keep unused factor levels. I'd actually like mine removed. I have several name variables and several columns (wide format) of variable attributes that I'm using to create numerous bar plots. Here's a reproducible example:
library(ggplot2)
df <- data.frame(name=c("A","B","C"), var1=c(1,NA,2),var2=c(3,4,5))
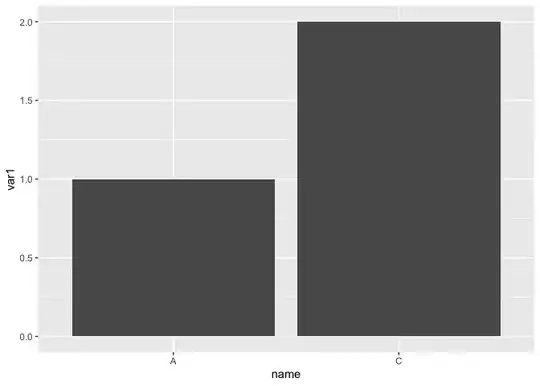
ggplot(df, aes(x=name,y=var1)) + geom_bar()
I get this:

I'd like only the names that have corresponding varn's show up in my bar plot (as in, there would be no empty space for B).
Reusing the base plot code will be quite easy if I can simply change my output file name and y=var bit. I'd like not have to subset my data frame just to use droplevels on the result for each plot if possible!
Update based on the na.omit() suggestion
Consider a revised data set:
library(ggplot2)
df <- data.frame(name=c("A","B","C"), var1=c(1,NA,2),var2=c(3,4,5), var3=c(NA,6,7))
ggplot(df, aes(x=name,y=var1)) + geom_bar()
I need to use na.omit() for plotting var1 because there's an NA present. But since na.omit makes sure values are present for all columns, the plot removes A as well since it has an NA in var3. This is more analogous to my data. I have 15 total responses with NAs peppered about. I only want to remove factor levels that don't have values for the current plotted y vector, not that have NAs in any vector in the whole data frame.