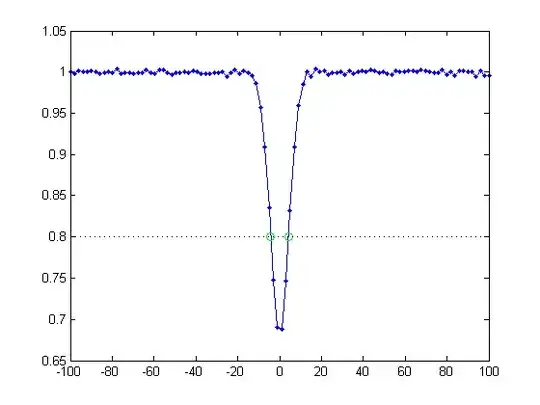
Here is the graph I currently have :

The Dotted Blue line represented the y value that corresponds to the x value I am looking for. I am trying to find the x values of the line's intersections with the blue curve(Upper).Since the interesections do not fall on a point that has already been defined, we need to interpolate a point that falls onto the Upper plot.
Here is the information I have:
LineValue - The y value of the intersection and the value of the dotted line( y = LineValue) Frequency - an array containing the x value coordinates seen on this plot. The interpolated values of Frequency that corresponds to LineValue are what we are looking for Upper/Lower - arrays containing the y value info for this graph