| Demographics of Grenada | |
|---|---|
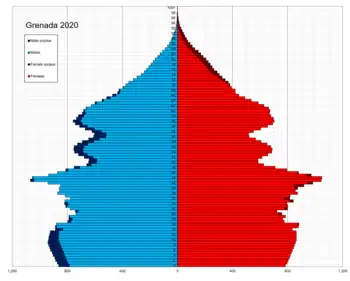 Population pyramid of Grenada in 2020 | |
| Population | 113,949 (2022 est.) |
| Growth rate | 0.32% (2022 est.) |
| Birth rate | 13.94 births/1,000 population (2022 est.) |
| Death rate | 8.31 deaths/1,000 population (2022 est.) |
| Life expectancy | 75.74 years |
| • male | 73.13 years |
| • female | 78.6 years |
| Fertility rate | 1.93 children born/woman (2022 est.) |
| Infant mortality rate | 9.4 deaths/1,000 live births |
| Net migration rate | -2.43 migrant(s)/1,000 population (2022 est.) |
| Age structure | |
| 0–14 years | 23.23% |
| 65 and over | 10.89% |
| Sex ratio | |
| Total | 1.03 male(s)/female (2022 est.) |
| At birth | 1.1 male(s)/female |
| Under 15 | 1.09 male(s)/female |
| 65 and over | 0.69 male(s)/female |
| Nationality | |
| Nationality | Grenadian |
| Major ethnic | African descent (82.4%) |
The demography of the population of Grenada includes population density, ethnicity, education level, health of the populace, economic status, religious affiliations and other aspects of the population.
| Year | Pop. | ±% p.a. |
|---|---|---|
| 1871 | 37,684 | — |
| 1881 | 42,403 | +1.19% |
| 1891 | 53,209 | +2.30% |
| 1901 | 63,438 | +1.77% |
| 1911 | 66,750 | +0.51% |
| 1921 | 66,302 | −0.07% |
| 1946 | 72,387 | +0.35% |
| 1960 | 88,677 | +1.46% |
| 1970 | 92,775 | +0.45% |
| 1981 | 89,088 | −0.37% |
| 1991 | 85,123 | −0.45% |
| 2001 | 103,137 | +1.94% |
| 2011 | 105,539 | +0.23% |
| Source:[1][2] | ||
Population
According to the 2011 census Grenada has 105,539 inhabitants.[2] The estimated population of 2021 is 124,610 (the 2022 revision of the World Population Prospects[3][4]).
Fertility rate
The fertility rate in Grenada was 2.21 in 2013.[2]
Vital statistics
| Average population (x 1000)[6] | Live births | Deaths | Natural change | Crude birth rate (per 1000) | Crude death rate (per 1000) | Natural change (per 1000) | Total fertility rate[7] | Infant mortality rate[7] | |
|---|---|---|---|---|---|---|---|---|---|
| 1950 | 77 | 2 962 | 1 056 | 1 906 | 38.6 | 13.8 | 24.9 | ||
| 1951 | 77 | 3 037 | 1 276 | 1 761 | 39.6 | 16.7 | 23.0 | ||
| 1952 | 77 | 3 119 | 1 255 | 1 864 | 40.4 | 16.3 | 24.2 | ||
| 1953 | 78 | 3 283 | 1 084 | 2 199 | 42.0 | 13.9 | 28.2 | ||
| 1954 | 79 | 3 507 | 793 | 2 714 | 44.2 | 10.0 | 34.2 | ||
| 1955 | 81 | 3 919 | 1 205 | 2 714 | 48.4 | 14.9 | 33.5 | ||
| 1956 | 83 | 3 627 | 1 179 | 2 448 | 43.8 | 14.2 | 29.6 | ||
| 1957 | 85 | 4 664 | 908 | 3 756 | 55.1 | 10.7 | 44.4 | ||
| 1958 | 86 | 4 253 | 973 | 3 280 | 49.2 | 11.2 | 37.9 | ||
| 1959 | 88 | 4 115 | 919 | 3 196 | 46.6 | 10.4 | 36.2 | ||
| 1960 | 90 | 4 016 | 1 032 | 2 984 | 44.7 | 11.5 | 33.2 | ||
| 1961 | 91 | 3 691 | 1 022 | 2 669 | 40.4 | 11.2 | 29.2 | ||
| 1962 | 92 | 3 419 | 840 | 2 579 | 37.0 | 9.1 | 27.9 | ||
| 1963 | 93 | 3 445 | 827 | 2 618 | 36.9 | 8.9 | 28.0 | ||
| 1964 | 94 | 3 374 | 804 | 2 570 | 35.9 | 8.5 | 27.3 | ||
| 1965 | 95 | 2 968 | 822 | 2 146 | 31.4 | 8.7 | 22.7 | ||
| 1966 | 95 | 2 820 | 852 | 1 968 | 29.7 | 9.0 | 20.7 | ||
| 1967 | 95 | 2 816 | 786 | 2 030 | 29.7 | 8.3 | 21.4 | ||
| 1968 | 95 | 2 994 | 822 | 2 172 | 31.6 | 8.7 | 22.9 | ||
| 1969 | 95 | 2 757 | 768 | 1 989 | 29.1 | 8.1 | 21.0 | ||
| 1970 | 94 | 2 741 | 743 | 1 998 | 29.0 | 7.9 | 21.2 | ||
| 1971 | 94 | 2 879 | 739 | 2 140 | 30.6 | 7.8 | 22.7 | ||
| 1972 | 94 | 2 939 | 660 | 2 279 | 31.3 | 7.0 | 24.3 | ||
| 1973 | 94 | 2 933 | 726 | 2 207 | 31.3 | 7.8 | 23.6 | ||
| 1974 | 93 | 2 734 | 734 | 2 000 | 29.4 | 7.9 | 21.5 | ||
| 1975 | 92 | 2 890 | 619 | 2 271 | 31.3 | 6.7 | 24.6 | ||
| 1976 | 91 | 2 712 | 678 | 2 034 | 29.7 | 7.4 | 22.2 | ||
| 1977 | 90 | 2 628 | 806 | 1 822 | 29.1 | 8.9 | 20.2 | ||
| 1978 | 89 | 2 521 | 765 | 1 756 | 28.3 | 8.6 | 19.7 | ||
| 1979 | 89 | 2 664 | 739 | 1 925 | 30.1 | 8.3 | 21.7 | ||
| 1993 | 97.056 | 2 220 | 745 | 1 475 | 22.6 | 7.6 | 15.0 | ||
| 1994 | 97.793 | 2 254 | 777 | 1 477 | 22.7 | 7.8 | 14.9 | ||
| 1995 | 98.540 | 2 286 | 807 | 1 479 | 22.8 | 8.0 | 14.8 | 12.7 | |
| 1996 | 98.921 | 2 096 | 782 | 1 314 | 20.8 | 7.8 | 13.0 | 14.3 | |
| 1997 | 99.516 | 2 191 | 707 | 1 484 | 21.7 | 7.0 | 14.7 | 14.1 | |
| 1998 | 100.100 | 1 938 | 819 | 1 119 | 19.1 | 8.1 | 11.0 | 19.1 | |
| 1999 | 100.703 | 1 791 | 794 | 997 | 17.7 | 7.8 | 9.8 | 15.2 | |
| 2000 | 101.308 | 1 883 | 765 | 1 118 | 18.5 | 7.5 | 11.0 | 14.3 | |
| 2001 | 103.143 | 1 899 | 727 | 1 172 | 18.6 | 7.1 | 11.5 | 17.4 | |
| 2002 | 104.068 | 1 756 | 887 | 869 | 16.9 | 8.5 | 8.4 | 20.5 | |
| 2003 | 104.769 | 1 851 | 810 | 1 041 | 17.7 | 7.7 | 10.0 | 11.9 | |
| 2004 | 104.712 | 1 868 | 884 | 984 | 17.8 | 8.4 | 9.4 | 9.6 | |
| 2005 | 104.441 | 1 804 | 834 | 970 | 17.3 | 8.0 | 9.3 | 2.2 | 9.4 |
| 2006 | 104.708 | 1 663 | 765 | 898 | 15.9 | 7.3 | 8.6 | 1.9 | 12.6 |
| 2007 | 104.981 | 1 825 | 740 | 1 085 | 17.4 | 7.0 | 10.4 | 2.2 | 7.1 |
| 2008 | 105.298 | 1 809 | 842 | 967 | 17.2 | 8.0 | 9.2 | 2.1 | 5.0 |
| 2009 | 105.175 | 1 800 | 781 | 1 019 | 17.1 | 7.4 | 9.7 | 2.0 | 7.8 |
| 2010 | 105.038 | 1 709 | 831 | 878 | 16.3 | 7.9 | 8.4 | 1.9 | 12.3 |
| 2011 | 106.667 | 1 812 | 795 | 1 017 | 17.0 | 7.5 | 9.5 | 2.18 | 15.5 |
| 2012 | 107.599 | 1 661 | 857 | 804 | 15.4 | 8.0 | 7.5 | 1.92 | 13.8 |
| 2013 | 108.580 | 1 838 | 822 | 1 016 | 16.9 | 7.6 | 9.4 | 2.13 | 17.4 |
| 2014 | 109.374 | 1 750 | 958 | 792 | 16.0 | 8.8 | 7.2 | 2.00 | 18.9 |
| 2015 | 110.096 | 1 694 | 869 | 825 | 15.4 | 7.9 | 7.5 | 1.8 | 16.5 |
| 2016 | 110.910 | 1 577 | 898 | 679 | 14.2 | 8.1 | 6.1 | 1.5 | 19.7 |
| 2017 | 111.467 | 1 398 | 885 | 513 | 12.5 | 7.9 | 4.6 | 1.7 | 24.3 |
| 2018 | 111.959 | 1 520 | 965 | 555 | 13.6 | 8.6 | 5.0 | 15.8 | |
| 2019 | 112.579 | 1 575 | 981 | 594 | 14.0 | 8.7 | 5.3 | 11.4 | |
| 2020 | 113.135 | 1 526 | 1 007 | 519 | 13.5 | 8.9 | 4.6 | 17.0 |
Structure of the population
| Age Group | Male | Female | Total | % |
|---|---|---|---|---|
| Total | 56 222 | 55 245 | 111 467 | 100 |
| 0–4 | 4 282 | 3 872 | 8 154 | 7.32 |
| 5–9 | 3 793 | 3 634 | 7 427 | 6.66 |
| 10–14 | 4 392 | 4 276 | 8 668 | 7.78 |
| 15–19 | 4 869 | 4 818 | 9 687 | 8.69 |
| 20–24 | 5 027 | 4 797 | 9 824 | 8.81 |
| 25–29 | 4 758 | 4 722 | 9 480 | 8.50 |
| 30–34 | 3 596 | 3 514 | 7 110 | 6.38 |
| 35–39 | 3 424 | 3 130 | 6 554 | 5.88 |
| 40–44 | 3 120 | 2 904 | 6 024 | 5.40 |
| 45–49 | 3 416 | 3 198 | 6 614 | 5.93 |
| 50–54 | 3 179 | 3 195 | 6 374 | 5.72 |
| 55–59 | 2 455 | 2 231 | 4 686 | 4.20 |
| 60–64 | 1 806 | 1 765 | 3 571 | 3.20 |
| 65-69 | 1 261 | 1 497 | 2 758 | 2.47 |
| 70-74 | 1 106 | 1 287 | 2 393 | 2.15 |
| 75-79 | 732 | 999 | 1 731 | 1.55 |
| 80-84 | 417 | 695 | 1 112 | 1.00 |
| 85-89 | 168 | 359 | 527 | 0.47 |
| 90+ | 78 | 197 | 275 | 0.25 |
| Age group | Male | Female | Total | Percent |
| 0–14 | 12 467 | 11 782 | 24 249 | 21.75 |
| 15–64 | 39 993 | 38 429 | 78 422 | 70.35 |
| 65+ | 3 762 | 5 034 | 8 796 | 7.89 |
Other demographics statistics
Demographic statistics according to the World Population Review in 2019:[9]
- One birth every 288 minutes
- One death every 480 minutes
- One net migrant every 1440 minutes
- Net gain of one person every 1440 minutes
Demographic statistics according to the CIA World Factbook, unless otherwise indicated:[10]
- Nationality
- noun: Grenadian(s)
- adjective: Grenadian
- Population
- 113,949 (2022 est.)
- Ethnic groups
- African descent 82.4%, mixed 13.3%, East Indian 2.2%, other 1.3%, unspecified 0.9% (2011 est.)
- Age structure

- 0-14 years: 23.23% (male 13,709 /female 12,564)
- 15-24 years: 14.14% (male 8,034 /female 7,959)
- 25-54 years: 40.05% (male 23,104 /female 22,187)
- 55-64 years: 11.69% (male 6,734 /female 6,490)
- 65 years and over: 10.89% (male 5,774 /female 6,539) (2020 est.)
- Median age
- total: 33.3 years. Country comparison to the world: 99th
- male: 33.1 years
- female: 33.4 years (2020 est.)
- Birth rate
- 13.94 births/1,000 population (2022 est.) Country comparison to the world: 128th
- Death rate
- 8.31 deaths/1,000 population (2022 est.) Country comparison to the world: 79th
- Total fertility rate
- 1.93 children born/woman (2022 est.) Country comparison to the world: 117th
- Net migration rate
- -2.43 migrant(s)/1,000 population (2022 est.) Country comparison to the world: 173rd
- Population growth rate
- 0.32% (2022 est.) Country comparison to the world: 169st
- Languages
- English (official), French patois
- Religions
- Protestant 49.2% (includes Pentecostal 17.2%, Seventh Day Adventist 13.2%, Anglican 8.5%, Baptist 3.2%, Church of God 2.4%, Evangelical 1.9%, Methodist 1.6%, other 1.2%), Roman Catholic 36%, Jehovah's Witness 1.2%, Rastafarian 1.2%, other 5.5%, none 5.7%, unspecified 1.3% (2011 est.)[11]
- Life expectancy at birth
- total population: 75.74 years
- male: 73.13 years
- female: 78.6 years (2022 est.)
- Dependency ratios
- total dependency ratio: 50.5 (2020 est.)
- youth dependency ratio: 35.8 (2020 est.)
- elderly dependency ratio: 14.7 (2020 est.)
- potential support ratio: 6.8 (2020 est.)
- Urbanization
- urban population: 36.9% of total population (2022)
- rate of urbanization: 0.86% annual rate of change (2020-25 est.)
- Obesity - adult prevalence rate
- 21.3% (2016). Country comparison to the world: 90th
- Literacy
definition: age 15 and over can read and write (2014 est.)
- total population: 98.6%
- male: 98.6%
- female: 98.6% (2014 est.)
- School life expectancy (primary to tertiary education)
- total: 17 years
- male: 16 years
- female: 17 years (2017)
Ethnic groups
The vast majority of the population of Grenada are of African descent (89.4% at the 2001 census).[1] There is also a significant mixed population (8.2%), along with a small European origin minority (0.4%), East Indians (1.6%), and there are small numbers of Lebanese/Syrians (0.04%) and Chinese (0.02%).
Amerindians
Grenada has a small population of pre-Columbian native Caribs. According to the 2001 census there are only 125 Caribs remaining (0.12% of the total population).
Languages
Apart from a 114-year period of French occupancy (1649-1763) English has been the country's official language. However, over time the minority of the population use a colloquial spoken language considered to be either English-based creole languages or (Grenadian Creole English) and which is said reflects the African, European and Indian heritage of the nation.[12]
The Grenadian creoles originally influenced by French, now contain elements from a variety of Grenadian Creole and a little of the African languages. Grenadian Creole French is mainly spoken in smaller rural areas, but today it can only be heard in a few small pockets of the society. Grenadian Creole French is mainly known as Patois and may have similarities to the Saint Lucian Creole French.
It is believed that the one-time native or indigenous languages were Iñeri and Karina.
Religion
Historically the religious makeup of the islands of Grenada covers the period from first European occupation in the 17th century. This has always been predominantly Christian and largely Roman Catholic (due to the first occupants being French) and from the 1891 census we get a snapshot of the population and its religious proclivities - over half were Roman Catholic (55%), a third were Church of England (36%), others listed were Wesleyan (6%) and Presbyterian (0.88%).
More recently, according to the government's 2011 information, 85.2% percent of the population of Grenada is considered Christian, 7.7% is non-Christian and 7% has no religious belief.[13] Roughly one third of Christians are Roman Catholics (36% of the total population), a reflection of early French influence on the island, and one half are Protestant (49.2%).
Anglicanism constitutes the largest Protestant group, with about 11.5% of the population. Pentecostals are the second largest group (about 11.3%), followed by Seventh-day Adventists (approximately 10.5% of the population). Other estimates include Baptists (2.9%), Church of God (2.6%), Methodists (1.8%), Evangelicals (1.6%) Jehovah's Witnesses (1.1%), and Brethren Christian (0.5%).
The number of non-Christians is small. These religious groups include the Rastafarian Movement (1.1% of the population), Hinduism (0.2%) and Muslims (0.3%).
References
- 1 2 "Archived copy" (PDF). Archived from the original (PDF) on 2015-09-23. Retrieved 2013-12-30.
{{cite web}}: CS1 maint: archived copy as title (link) - 1 2 3 "Archived copy" (PDF). Archived from the original (PDF) on 2018-07-13. Retrieved 2018-09-27.
{{cite web}}: CS1 maint: archived copy as title (link) - ↑ "World Population Prospects 2022". population.un.org. United Nations Department of Economic and Social Affairs, Population Division. Retrieved July 17, 2022.
- ↑ "World Population Prospects 2022: Demographic indicators by region, subregion and country, annually for 1950-2100" (XSLX). population.un.org ("Total Population, as of 1 July (thousands)"). United Nations Department of Economic and Social Affairs, Population Division. Retrieved July 17, 2022.
- ↑ "test". Archived from the original on 2012-09-18.
- ↑ United nations. Demographic Yearbooks. 2001
- 1 2 Archived 2012-09-16 at the Wayback Machine Demographic Profile Grenada
- ↑ "UNSD - Demographic and Social Statistics". unstats.un.org. Retrieved 2023-05-10.
- ↑ "Grenada Population 2019", World Population Review
- ↑
 This article incorporates text from this source, which is in the public domain: "World Factbook CENTRAL AMERICA : GRENADA", The World Factbook, July 12, 2018
 - ↑ US State Dept 2022 report
- ↑ Alleyne, Mervyn C. "A Linguistic Perspective on the Caribbean", Latin American Program, Woodrow Wilson International Center for Scholars, 1985
- ↑ US State Dept 2022 report