5

Generally I know how set breakpoints, inspect variables, step into functions etc...

Default.htm consists of hundreds of scripts and empty placeholders.

Ideally I would like to proceed step-by-step. Setting breakpoint in the first line like that doesn't work:

Sample breakpoint

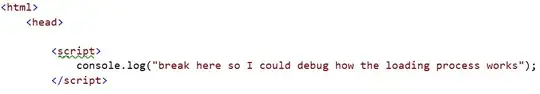
When I step over next function call it is long gone (everything has loaded).

Chrome Developer Tools

Generally how do I debug asynchronously loading scripts? (timeline clearly indicates that they are loading simultaneously)

Maybe I should use HTTP proxy such as Fiddler? I know how to set simple breakpoint (BPU) and then? fiddler breakpoint

In other words - which approach - How can I debug my JavaScript code? - is tailored to my needs?

Community
  • 1
  • 1
Mars Robertson
  • 12,673
  • 11
  • 68
  • 89
  • 3
    eventhough they're loaded simultanously, most probably they're executed one after the other (in 1 thread), Just add a breakpoint to the 1st line of each one, and you can go step-by-step from there – Gavriel Apr 16 '12 at 10:15
  • actually even your approach should work IMHO. give it a try: when you stopped on your 1st line, type in your console some variable. I'm pretty sure it's still undefined, because although the network layer probably finished downloading it, the javascript wasn't evaluated yet. As you go step by step you should indeed be able to see it evaluated line by line – Gavriel Apr 16 '12 at 11:00
  • Making use of an IDE such as PHPStorm, Netbeans, etc... or use Firebug on Firefox, Chrome Developer tools and some internet explorer Developer tools as well – Joberror Apr 16 '12 at 11:01
  • I tried to use this approach - there a simply too many files and most of them are in a form of `(function ($) { $.fn.extend({ DisplayPane: function () {` Ideally I would like to have **one click** to see all requests, actions and traffic. – Mars Robertson Apr 16 '12 at 11:11
  • Comments are getting messy, apparently I can edit only immediately after submission. @joberror - I'm using dev tools, see attached screenshots. The problem is - there are 50 scripts loading at the same time and I want to see what's actually happening there. I suppose loading order is not important. Maybe I could set breakpoints on DOM modification? Either way - thanks for suggestions! – Mars Robertson Apr 16 '12 at 11:15
  • Yes! Setting a breakpoint is the best solution even using of the IDEs or Plugins I mentioned earlier, you are still going to set breakpoints. Just that some gives more details than other. – Joberror Apr 16 '12 at 11:26

1 Answers1

2

If you are using chrome dev tools:

  1. let the site load
  2. Put a break point at the entry point of your js. (if you don't know where this is, but a breakpoint at the outermost scope of each of the files under the Sources tab.
  3. F5 (refresh the web page)
  4. First break point that gets hit is your entry point. F11 - step into, F10 = step over.

Hope this helps.

Stumpy7
  • 252
  • 3
  • 14