23

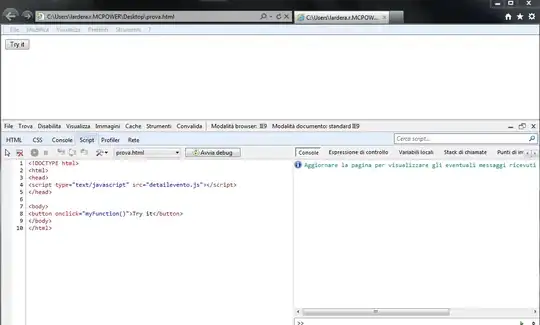
I am trying to debug my JavaScript in IE but I have no idea where to start. Can anybody help me? I think it's only a small error, but the developer tools are a bit useless.

An unexpected identifier error comes up when you go to http://songtagapp.com/. I think it's something to do with the tpl! plugin I am using for RequireJS, but that's all I can tell.

Eliran Malka
  • 15,821
  • 6
  • 77
  • 100
  • Take a look at this [answer](http://stackoverflow.com/questions/6638132/how-to-save-the-javascript-errors-in-file/6638310#6638310) – Bakudan Apr 17 '12 at 12:21
  • 5
    "*but the developer tools are a bit useless"* What makes you say that? They're not quite as advanced as those in Chrome or the Firebug plugin for Firefox, but you can single-step code, set breakpoints, etc. – T.J. Crowder Apr 17 '12 at 12:23
  • you can also use console.log() to detect the problem:) – Dmitry Belaventsev Apr 17 '12 at 12:24
  • I'm not seeing any errors in IE7, IE8, or IE9 in my dev tools. Is there something that triggers the error? – Code Maverick Apr 17 '12 at 12:26
  • In Chrome, however, I see, `Unsafe JavaScript attempt to access frame with URL http://songtagapp.com/ from frame with URL http://player.vimeo.com/video/38158392?color=80C639. Domains, protocols and ports must match.` – Code Maverick Apr 17 '12 at 12:28
  • Scott, just going to the page gives me an error. Not for you? None of my JavaScript works at all. –  Apr 17 '12 at 12:34
  • 3
    It crashes on line 178 in tpl.js You should realy learn how to debug js in IE or you will not survive ;-) – Gatekeeper Apr 17 '12 at 12:47
  • Why does it crash?! tpl.js is just a plugin. –  Apr 17 '12 at 13:32
  • @OliverJosephAsh - plugins have bugs, too :) – Eliran Malka Apr 18 '12 at 07:15

2 Answers2

23

Several options:

  • Open the IE developer tools (by hitting F12 while in the browser), and use the provided JavaScript debugger. To get to know it better, see the MSDN reference on using the JavaScript debugger (and a newer reference).
  • Install Debug Bar, which provides an extended feature-set to the built-in developer tools.
  • Install IE Tester, which emulates various IE instances (versions), and use its built-in Debug Bar. With that approach, you can also pin-point version-specific problems.
Community
  • 1
  • 1
Eliran Malka
  • 15,821
  • 6
  • 77
  • 100
  • 2
    A bit late, but, I had a similar problem. What you need to do is to click on the Start Debugging button after you have set the breakpoints. Simply reloading the page after setting the breakpoints doesn't seem to work. – Mark Feb 13 '14 at 05:52
  • I don't see any Start Debugging button. I can't set breakpoints in my scripts (linked js files). IE doesn't even report them. – brennanyoung May 23 '18 at 12:28
5

You can use IE (by hitting F12 while in the browser)enter image description here

enter image description here

enter image description here

Frizz1977
  • 1,121
  • 13
  • 21