1

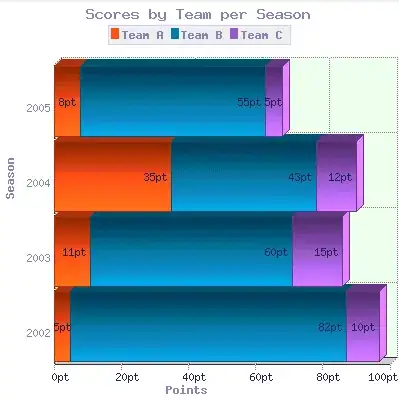
I want to create a stacked bar graph as in url below

image
(source: jpowered.com)

I want to make hyperlink for each of the red ,violet and blue boxes.The graph is possible with jfree chart but i don't know how to make each of the individual bars as URL so that a click on it can refresh the page. Is it possible to do it with jfree chart?

Does Jquery plot help in this case to make each box url enabled ?Please suggest.

Community
  • 1
  • 1

2 Answers2

2

Using , you can apply a CategoryURLGenerator to the plot using whichever of the two implementations better suits your needs. The approach is outlined here for the related PieURLGenerator. ChartFactory.createStackedBarChart() uses a StackedBarRenderer and allows PlotOrientation.HORIZONTAL.

Addendum: To generate URLs for individual items, you can examine the ChartEntity returned in a ChartMouseListener, as shown here.

Community
  • 1
  • 1
trashgod
  • 203,806
  • 29
  • 246
  • 1,045
  • +1 Reading your answers it looks that in jfreechart this sort of thing is neatly solved. Thanks, I was not aware of it before. All the best and very good to see you. :) – Boro Apr 26 '12 at 08:13
  • Sorry for overlooking the essence of your question earlier; more above. – trashgod Apr 26 '12 at 10:04
1

I know that you can achieve something like this in jqPlot without much trouble. The only think you need to remember, after you create your plot, is to bind your function to jqplotDataClick event. In your function you would need to map your clicks to a structure of urls. I have presented this in a sample example, where only the first series' bars take you to some websites. The sample is on jsfiddle --- it could be found here.

Effectively all comes down to this piece of code:

  var urls = ["www.yahoo.com", "www.google.com", "www.java.com", "www.w3schools.com/js/js_obj_date.asp"];
  $('#chart').bind('jqplotDataClick', function (ev, seriesIndex, pointIndex, data) {
      if(seriesIndex === 0){
          var url = urls[pointIndex];
          window.open("http://"+url);
      }
  });

EDIT

I do not know an easy way, i.e. that wouldn't involve changing the script of jqPlot, of identifying the clicked bar by highlighting its background. Though I figured out a way to get a similar effect by coloring background of point labels which are on bars, the code would also need to be in the jqplotDataClicked, something like:

var prevClicked;
var prevBackgroundColor;
$('#chart').bind('jqplotDataClick', function (ev, seriesIndex, pointIndex, data) {
    var str = ".jqplot-point-label.jqplot-series-"+seriesIndex+".jqplot-point-"+pointIndex;
    $(str).each(function(){
        if(prevClicked)
            $(prevClicked).css('background-color', prevBackgroundColor);
        prevClicked = this;
        prevBackgroundColor = $(prevClicked).css('background-color');
        $(prevClicked).css('background-color', 'red');
    });
});

You just find the clicked point label using jQuery and apply your style, e.g. changing background color, remembering the previous label so you can remove its color to previous state on click on another bar. First I tried using addClass/removeClass functions but it didn't change a label's style, thus I had to use the css function instead.
Boro
  • 7,913
  • 4
  • 43
  • 85
  • I was previously unfamiliar with this `jqPlot`. It looks like a good choice for interactive plots in the browser. [tag:jfreechart] has `org.jfree.chart.imagemap` support. +1 from earlier today. – trashgod Apr 26 '12 at 10:03
  • Yea `jqPlot` is a good choice when you need a chart in a browser. If you also mix into it some of your own jquery scripts you could get effectivelly all you can want form a chart from this library. Thought this library is not that polished as the commercial versions might be but this one is **free** and it has a very nice (for javascript standards :)) documentation. – Boro Apr 26 '12 at 10:14
  • Hi Boro, i am able to make the jqplot char.How to keep a clicked bar highlighted with a separate colour to identify that it was clicked.It shows hovered color on mouseover.How to show different color on mouse click.I want to open a new page and show the clicked bar data on the page along with the graph.So that data is of clicked part shows highlighted. – jboss problem May 01 '12 at 20:19
  • Will the jfree chart with clickable property work with struts framework.I am seeing jfree chart clickable property as swing inside an applet.Will it be integrable with struts page or simple html page? – jboss problem May 01 '12 at 20:21
  • Hi jboss problem, with regards to your first question I have added **EDIT** to show what I got for this problem. But when it comes to your other comment you would be better asking @trashgod about it since I think his experience with `jfreechart` is greater than mine. I only used it in my `swing` app to present my research result in my PhD. I would never intend to use it in a browser, as I guess this is what you are after, right? For me `jfreechart` is just for creating graphs in local Java apps. – Boro May 02 '12 at 08:50
  • @jbossproblem: I'm not sure I can add much. On web pages, I use `ChartUtilities` to stream static images or [tag:java-web-start] for interactive applications. – trashgod May 02 '12 at 11:09
  • Thanks Boro your solution is very useful. – jboss problem May 03 '12 at 16:57