1

I am looking for a way to extract information out of a chromatogram out of a GC or HPLC. A chromatogram looks like this:

Chromatogram

I am not really into image processing/analysis so I'm looking for a tool/algorithim to extract the length (and the surface under a peak if possible) of a peak from those chromatograms. The solutions can either be in Python or in C#.

Thanks in advance.

wvd
  • 1,189
  • 2
  • 12
  • 23
  • Will the chromatograms have the numbers and axis (as shown)? Or can we assume they will be clean? ie. no text or axis – fraxel Apr 28 '12 at 20:51
  • I'm not sure if you are aware of the complexity of what you are looking for. What kind of file format do you have? binary – joaquin Apr 28 '12 at 21:04
  • @fraxel, we can assume they are clean, or with frame. that doesn't matter at this state. joaquin, no I am not aware of the level of complexity, it are all image formats (so .PNG in this case) – wvd Apr 28 '12 at 21:07
  • well, long time ago the method was to cut the peaks with a scissor and to weight the pieces of paper. Python was not there yet (neither PC's). – joaquin Apr 28 '12 at 21:15
  • Do I understand you correctly, that you only have access to the images and not the data, and thus need a reverse way of creating the curve? Or do you have the data and thus can use the answer provided below? – deinonychusaur Apr 28 '12 at 22:16
  • Maybe you should check [OpenChrome](http://www.openchrom.net/main/content/index.php). There are also other chromatogram viewers and format converters [here](http://www.ms-utils.org/wiki/pmwiki.php/Main/SoftwareList). – joaquin Apr 28 '12 at 21:11
  • Hey there, updated my answer to include a basic approach to finding peaks and areas :) – fraxel Apr 30 '12 at 13:19

2 Answers2

3

I've written some quick python code that will extract chromatogram (or any single-valued) data from an image file.

It has the following requirements:

  • Image is clean (no text or other data).
  • Curve is single valued, ie. curve pixel width of one (it will still work without this, but it will always take the upper value).
  • Scales are linear.

It is very simple, and just iterates through each column of the image and takes the first black value as the data point. It uses PIL. These data points are initially in the image co-ordinate system, so need to be rescaled to the data co-ordinate system, if all your images share the same axis, this is straight forward, otherwise it needs to be done manually on a per image basis (automation would be more involved).

The image below shows where I extracted your image (I removed the text) for processing (non-pink region), so for re-scaling we just take the white box region in the data co-ordinate system: x_range = 4.4 - 0.55, x_offset = 0.55, y_range = 23000 - 2500, and y_offset = 2500.

enter image description here

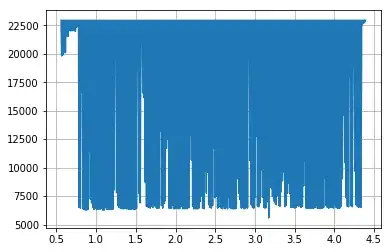
Here is the extracted data replotted with pyplot: enter image description here

Here is the code:

import Image
import numpy as np

def get_data(im, x_range, x_offset, y_range, y_offset):
    x_data = np.array([])
    y_data = np.array([])
    width, height = im.size
    im = im.convert('1')
    for x in xrange(width):
        for y in xrange(height):
            if im.getpixel((x, y)) == 0:
                x_data = np.append(x_data, x)
                y_data = np.append(y_data, height - y)
                break
    x_data = (x_data / width) * x_range + x_offset
    y_data = (y_data / height) * y_range + y_offset
    return x_data, y_data

im = Image.open('clean_data_2.png')
x_data, y_data = get_data(im,4.4-0.55,0.55,23000-2500,2500)

from pylab import *
plot(x_data, y_data)
grid(True)
savefig('new_data.png')
show()

Once you have your data as numpy arrays, there are many options you can use to find peaks and the corresponding areas under them (see this discussion for some approaches). Noise is a large concern, so a general approach would be to convolve the data to smooth the noise out (or you could threshold if your peaks are sharp) then differentiate to find peaks. To find areas under peaks you can do numerical integration across the peak region.

I've made a couple of assumptions and written some simple code (below), to illustrate a possible approach. I've thresholded the data so only peaks above 5000 survive, then we iterate through the data finding the peaks, and using the trapeze rule, np.trapz, to find the area under each peak. Where peaks overlap the areas are split at the overlap point (I doubt this is standard..). Also this code will only recognize peaks that are local maxima (shoulders will not be detected). I've graphed the results, writing the area values for each peak at the corresponding peak position: enter image description here

def find_peak(start, grad):
    for index, gr in enumerate(grad[start:]):
        if gr < 0:
            return index + start

def find_end(peak, grad):
    for index, gr in enumerate(grad[peak:]):
        if gr >= 0:
            return index + peak + 1

def find_peaks(grad):
    peaks=[]
    i = 0
    while i < len(grad[:-1]):
        if grad[i] > 0:
            start = i
            peak_index = find_peak(start, grad)
            end = find_end(peak_index, grad)
            area = np.trapz(y_data[start:end], x_data[start:end])
            peaks.append((x_data[peak_index], y_data[peak_index], area))
            i = end - 1
        else:
            i+=1
    return peaks

y_data = np.where(y_data > 5000, y_data, 0)

grad = np.diff(y_data)

peaks = find_peaks(grad)

from pylab import *
plot(x_data, y_data)    
for peak in peaks:
    text(peak[0], 1.01*peak[1], '%d'%int(peak[2]))
grid(True)
show()

Whatever approach you take at this point requires assumptions about your data (which I am not really in a position to make! Although I made a few above!), how do you deal with overlapping peaks? etc.. I am sure there are standard approaches in chromatography, so really you need to check that out first. Hope this helps!

Community
  • 1
  • 1
fraxel
  • 34,470
  • 11
  • 98
  • 102
  • Looks pretty good! I am sure I can use this and specialize it further. About the data; the data will always be verified by a human before using the program, so dealing with things such as overlaying peaks won't be a problem for me. Thank you very much for this excellent answer! – wvd May 02 '12 at 14:16
  • Last question; sometimes the height of the peak is printed on top of the peak (just a very little above) such as; http://i49.tinypic.com/vi0hup.png - do you have a suggested approach of programming removing this? I don't need a full example like this, just some point where I could look to or something. – wvd May 02 '12 at 14:22
  • @wvd - thanks :) . I don't think those numbers can represent the height of the peaks as `1.995` is way smaller than `1.545`? you might be a bit stuck here, as it looks like the peaks are actually cropped beyond the image, so we don't know their actual heights -unless we DO have that info - in which case we would need to extrapolate our curve based on that peak data. A bunch more examples to really tell. Might be worth opening another question? – fraxel May 02 '12 at 15:46
  • ho I gave you the wrong information. The numbers displayed are actually the retention time (x-axis), and since this is the new chromatogram format we will be working with i got kind of a problem. Is there some conventient way to strip those numbers out without affecting any of the peaks? – wvd May 02 '12 at 16:57
  • That makes more sense, I still think you have a big problem with the peaks being cropped. Looking at that image, I see 6 peaks, with the 2nd and 3rd ones maxima being well outside the image (I think the third peak is massive, with edges between 1.219 and 1.298?). Do you have any control over the output format of the chromatograms? Failing that, it looks like the numbers are printed in a consistent format (3dp.) starting at the same height. There is no easy way (as the numbers are on top of some of the data). – fraxel May 02 '12 at 17:15
  • @wvd - But, this would allow you to do a search for numerical characters at predictable positions, using some recognition procedure. matched numbers could then be removed exactly, and the remaining data extrapolated. But it looks like you are going to have to extrapolate beyond the image anyhow, so that may be more of an issue.... :( – fraxel May 02 '12 at 17:17
  • Well, I just cropped the image myself so I will get the full peak anyhow, and I have full control of the data whos going in. But thanks, let's see if I can get it to work somehow :) – wvd May 02 '12 at 17:23
0

When i use this code I get the following image

created image

The code is the same as above (with slight modifications)

from PIL import Image
import numpy as np


def get_data(im, x_range, x_offset, y_range, y_offset):
    x_data = np.array([])
    y_data = np.array([])
    width, height = im.size
    im = im.convert('1')
    for x in range(width):
        for y in range(height):
            if im.getpixel((x, y)) == 0:
                x_data = np.append(x_data, x)
                y_data = np.append(y_data, height - y)
                break
    x_data = (x_data / width) * x_range + x_offset
    y_data = (y_data / height) * y_range + y_offset
    return x_data, y_data

im = Image.open('C:\Python\HPLC.png')
x_data, y_data = get_data(im,4.4-0.55,0.55,23000-2500,2500)

from pylab import *
plot(x_data, y_data)
grid(True)
savefig('new_data.png')
show()

I am not quite sure what the problem might be.
Matthieu Brucher
  • 21,634
  • 7
  • 38
  • 62
Julian
  • 11