8

This is a continuation of the question here: Create non-overlapping stacked area plot with ggplot2

I have a ggplot2 area chart created by the following code. I want the labels from names be aligned on the right side of the graph. I think directlabels might work, but am willing to try whatever is most clever.

require(ggplot2)
require(plyr)
require(RColorBrewer)
require(RCurl)
require(directlabels)

link <- getURL("http://dl.dropbox.com/u/25609375/so_data/final.txt")
dat <- read.csv(textConnection(link), sep=' ', header=FALSE, 
         col.names=c('count', 'name', 'episode'))


dat <- ddply(dat, .(episode), transform, percent = count / sum(count))

# needed to make geom_area not freak out because of missing value
dat2 <- rbind(dat, data.frame(count = 0, name = 'lane',
                             episode = '02-tea-leaves', percent = 0))

g <- ggplot(arrange(dat2,name,episode), aes(x=episode,y=percent)) + 
  geom_area(aes(fill=name, group = name), position='stack') + scale_fill_brewer()

g1 <- g + geom_dl(method='last.points', aes(label=name))

enter image description here

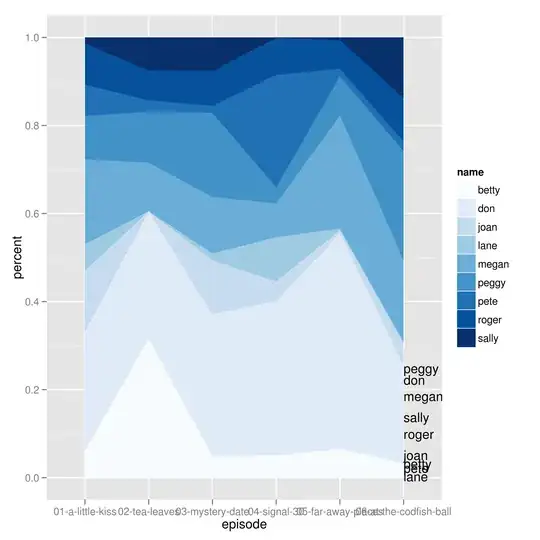
I'm brand new to directlabels and not really sure how to get the labels to align to right side of the graph with the same colors as the areas.

Community
  • 1
  • 1
Idr
  • 6,000
  • 6
  • 34
  • 49

1 Answers1

11

You can use simple geom_text to add labels. First, subset you data set to get the final x value:

dd=subset(dat, episode=="06-at-the-codfish-ball")

Then order the data frame by factor level:

dd = dd[with(dd, order(name, levels(dd$name))),]

Then work out the cumulative percent for plotting:

dd$cum = cumsum(dd$percent)

Then just use a standard geom_text call:

g + geom_text(data=dd, aes(x=6, y=cum, label=name))

Oh, and you may want to angle your x-axis labels to avoid over plotting:

g + opts(axis.text.x=theme_text(angle=-25, hjust=0.5, size = 8))

Graph

enter image description here

csgillespie
  • 59,189
  • 14
  • 150
  • 185
  • Thanks for the answer. I need to figure out directlabels, cause I don't know how general-izable this approach is. – Idr May 02 '12 at 14:55
  • 2
    @csgillespie, This was useful thanks. Here the syntax I used (another df): ``+ geom_text(data = subset(df, Year == "2012"), aes(x = Year, y = cumsum(value), label = variable), vjust = 6, hjust = -.2, size = 4)``, where I found it fiddly to get the ``vjust`` and ``hjust`` parameters right. I'm saying it to emphasize that you can pass ``cumsum`` to the ``aes()``, which I discovered by trial and error. For the legend on the right, it's useful to set ``+ guides(fill = guide_legend(reverse = TRUE))`` to get the colours in the same order as the image. Do you want to update the deprecated ``opts``? – PatrickT Dec 13 '14 at 18:30
  • And to catch the last element of the dataframe (``06-at-the-codfish-ball`` in the OP and ``2012`` in my comment above), you can use the ``tail()`` function with argument `1`, e.g. ``tail(df2.1$Year, 1)`` – PatrickT Dec 13 '14 at 18:38