I have app that sometimes crashes in navigating through Navigation bar and in console log is no error except this ->
(lldb)
How can I check where is error?
I have app that sometimes crashes in navigating through Navigation bar and in console log is no error except this ->
(lldb)
How can I check where is error?
In Xcode, go to Product > Edit Scheme > Diagnostics > Enable Zombie Object
Now run the app and check the console.
try enable zombie objects from
produt>edit schems> enable zombi
See a recent answer I posted here:
When the debugger stops, go to the "Debug Navigator" and make sure the slider on the bottom is all the way to the right.
Scan your eye down from the point at which the exception is thrown and you should eventually come to your own code. Click on the appropriate method/function name and the code will be opened in the editor.
If you don't see any of your own methods in the stack trace, the exception may have been passed through a performSelector-style call in which case the stack trace is gone. If this is the case, you may get better information by adding an "On Throw" exception break point. First switch to the "Breakpoint navigator":

Then click on the plus and choose "Add Exception breakpoint..."
Create an "On Throw" break point:
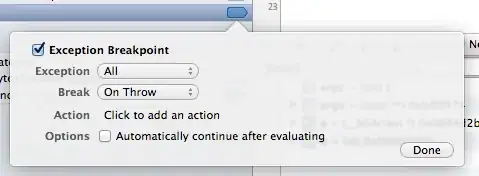
This will stop the debugger at the exact point the exception is thrown, and you get a better stack trace. It's a good idea to have an exception break point like this enabled all the time.
Type bt at the lldb prompt and it will give you a stack trace telling where the app crashed.