I plotted the values using this code:
png(filename="q.png", width=3000, height=1600, units="px")
but the values on x and y axes appeared to be too small. I want to magnify them. How do I do that?
I plotted the values using this code:
png(filename="q.png", width=3000, height=1600, units="px")
but the values on x and y axes appeared to be too small. I want to magnify them. How do I do that?
I suspect that you need to change it when you plot the graph, for example:
 par(mar=c(4,5,1,1))
 plot(rnorm(30), xlab= "Big font", ylab = "Big font", cex.lab = 2, cex.axis = 1.5)

EDITED 1: To change the title size:
par(mar=c(5,5,4,1))
plot(rnorm(30), xlab= "Big font", ylab = "Big font",
    cex.lab = 2, cex.axis = 1.5, cex.main=3, main="Big Font")

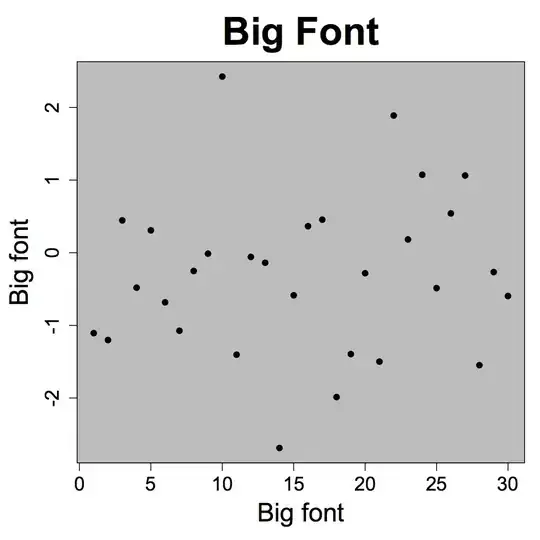
EDITED 2: Shaded plot area. Not sure if this is the best way to do it. There may be simpler and more elegant ways to shade the plot area.
a = rnorm(30)
par(mar=c(5,5,4,1))
plot(a, xlab= "Big font", ylab = "Big font", type="n",
     cex.lab = 2, cex.axis = 1.5, cex.main=3, main="Big Font")
x <- par("usr")
rect(x[1], x[3], x[2], x[4], col = "grey")
points(a, pch=19)
You can set the text magnification with 'par':
opar <- par(cex.axis = 1.5)
# plotting commands
par(opar)
In addition, to set the main text, labels and sub-title text sizes with cex.main, cex.lab and cex.sub, respectively:
opar <- par(cex.axis = 1.5, cex.main = 1.5, cex.lab = 1.5, cex.sub = 1.5)
...
Setting 'cex' alone will also magnify the plotted symbols, which may be appropriate, and may not.
These are described in ?par
Include cex.main, cex.sub, cex.lab in your plot command.
search for par in this link. this is a search directory for all commands of r software