Question 1: Suppose I have a function like the one below, which allows me to plot lines and also print multiple lines of texts below the x-axis (Sorry that it is the simplest code that I could come up with. I am open to any suggestions on how to make it neater!). When there is more than one line of text below the x-axis, it will probably overlap with the x-axis label. So I decided to use mtext() to plot the x-axis label.
Sampleplot = function(x, text, xlab = NULL,...){
if(!is.null(text)){
text.n=length(text) #Number of lines of text
text.n2=length(text[[1]]) #Number of words. Here I am assuming equal number in
#each list item
text.n=rep(1:text.n, each=text.n2)
matplot(x, axes = FALSE,...)
axis(2)
axis(1, labels = FALSE,at = 1:text.n2)
args.mtext=c(mtext, list(text=unlist(text),
line=text.n, at=1:text.n2, side=1))
mtext(xlab, line=max(text.n+1.5), side=1)
invisible(do.call(mapply, args.mtext))
}else matplot(x,...)
}
#Dataset and texts
dataset = cbind(sort(rlnorm(4)),sort(rlnorm(4)),sort(rlnorm(4)))
texts = list(letters[1:4], 1:4, letters[11:14])
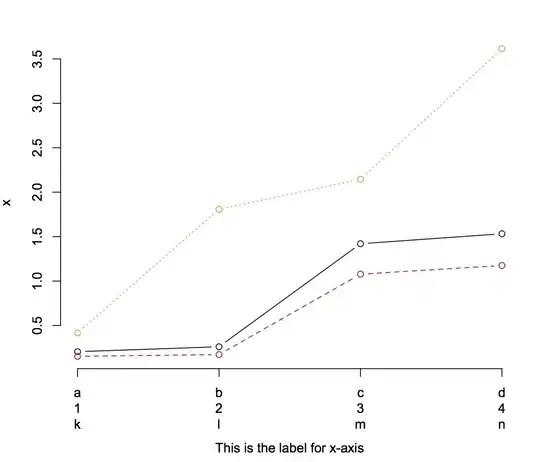
#Sample plot:
par(mar=c(10,6,4,2))
Sampleplot(dataset, texts, xlab = "This is the label for x-axis",
type="b", pch=1)
Now, suppose I would like to increase the label size:
 Sampleplot(dataset, texts, xlab = "This is the label for x-axis",
            type="b", pch=1, cex.lab=3)
Of course, this is not going to do anything for the x axis label since it's created not using matplot() but using mtext().
One possible solution is to make cex.lab an explicit argument in the function, and also add it in matplot
Sampleplot2 = function(x, text, xlab = NULL, cex.lab = NULL, ...){      #<- HERE!!
    if(is.null(cex.lab)) cex.lab = 1
    if(!is.null(text)){
        text.n=length(text)       #Number of lines of text
        text.n2=length(text[[1]]) #Number of words. Here I am assuming equal number in
                                  #each list item
        text.n=rep(1:text.n, each=text.n2)
        matplot(x, axes = FALSE, cex.lab=cex.lab,...)                #<- HERE!
        axis(2)
        axis(1, labels = FALSE,at = 1:text.n2)
        args.mtext=c(mtext, list(text=unlist(text),
                     line=text.n, at=1:text.n2, side=1))
        mtext(xlab, line=max(text.n+1.5), side=1, cex=cex.lab)   #<- HERE!
        invisible(do.call(mapply, args.mtext))
    }else matplot(x,...)
 }

 par(mar=c(10,6,4,2))
 Sampleplot2(dataset, texts, xlab = "This is the label for x-axis",
            type="b", pch=1, cex.lab=2)

However, this solution seems far from elegant. So I wonder if there is any way to pass the cex.lab value WITHOUT having to explicitly put it in the function definition. I tried to use par()$cex.lab, but unlike par()$mar, which gives you the current margin status, par()$cex.lab only seems to give you the default label size, which is 1.
Question 2: As you can see in my plots, the spacing between the different lines of texts is kind of wide. I wonder if there is any way I can measure the height of the text, and I can use the height to perhaps decide how wide the space should be between different lines of texts.
Thank you guys in advance!