3

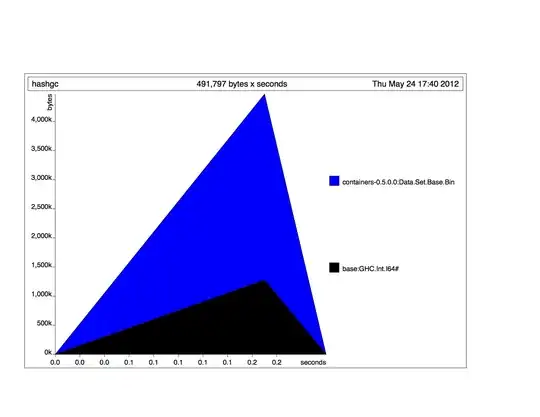
This program creates a very large set to find a hash function collision. Is there a way to reduce the amount of time spent in GC? +RTS -s is reporting 40+% time spent in GC.

Example usage:

./program 0 1000000 +RTS -s
./program 145168473 10200000 +RTS -s

Is there a better algorithm or data structure I can use?

{-# LANGUAGE OverloadedStrings #-}

import System.Environment
import Control.Monad
import Crypto.Hash.SHA256

import qualified Data.ByteString.Char8 as B
import qualified Data.ByteString.Lazy.Char8 as BL
import Data.Char
import Data.Int
import Data.Bits
import Data.Binary
import Data.Set as Set
import Data.List
import Numeric

str2int :: (Integral a) => B.ByteString -> a
str2int bs = B.foldl (\a w -> (a * 256)+(fromIntegral $ ord w)) 0 bs

t50 :: Int64 -> Int64
t50 i = let h = hash $ B.concat $ BL.toChunks $ encode i
        in
          (str2int $ B.drop 25 h) .&. 0x3ffffffffffff

sha256 :: Int64 -> B.ByteString
sha256 i = hash $ B.concat $ BL.toChunks $ encode i

-- firstCollision :: Ord b => (a -> b) -> [a] -> Maybe a
firstCollision f xs = go f Set.empty xs
  where
    -- go :: Ord b => (a -> b) -> Set b -> [a] -> Maybe a
    go _ _ []     = Nothing
    go f s (x:xs) = let y = f x
                    in
                      if y `Set.member` s
                        then Just x
                        else go f (Set.insert y s) xs

showHex2 i
  | i < 16    = "0" ++ (showHex i "")
  | otherwise = showHex i ""

prettyPrint :: B.ByteString -> String
prettyPrint = concat . (Data.List.map showHex2) . (Data.List.map ord) . B.unpack


showhash inp =
  let  h = sha256 inp
       x = B.concat $ BL.toChunks $ encode inp
   in do putStrLn $ "  - input: " ++ (prettyPrint x) ++ " -- " ++ (show inp)
         putStrLn $ "  -  hash: " ++ (prettyPrint h)

main = do
         args <- getArgs
         let a = (read $ args !! 0) :: Int64
             b = (read $ args !! 1) :: Int64
             c = firstCollision t [a..(a+b)]
             t = t50
         case c of
           Nothing -> putStrLn "No collision found"
           Just x  -> do let h = t x
                         putStrLn $ "Found collision at " ++ (show x)
                         showhash x
                         let first = find (\x -> (t x) == h) [a..(a+b)]
                          in case first of
                               Nothing -> putStrLn "oops -- failed to find hash"
                               Just x0 -> do putStrLn $ "first instance at " ++ (show x0)
                                             showhash x0
ErikR
  • 51,541
  • 9
  • 73
  • 124
  • 3
    Use heap profiling to figure out what's going on. – augustss May 24 '12 at 04:52
  • 1
    Did you try increasing the allocation area with e.g. `-RTS -A100M` for 100MB? This can sometimes help by reducing how frequently the GC runs. For a program like this, where most of the produced data is kept for a while, it can make a big difference. – John L May 24 '12 at 10:03
  • `s` should be strict in `firstCollision`'s worker – luqui May 24 '12 at 16:48

3 Answers3

4

As you notice, the GC stats report low productivity:

  44,184,375,988 bytes allocated in the heap
   1,244,120,552 bytes copied during GC
      39,315,612 bytes maximum residency (42 sample(s))
         545,688 bytes maximum slop
             109 MB total memory in use (0 MB lost due to fragmentation)

                                    Tot time (elapsed)  Avg pause  Max pause
  Gen  0     81400 colls,     0 par    2.47s    2.40s     0.0000s    0.0003s
  Gen  1        42 colls,     0 par    1.06s    1.08s     0.0258s    0.1203s

  INIT    time    0.00s  (  0.00s elapsed)
  MUT     time    4.58s  (  4.63s elapsed)
  GC      time    3.53s  (  3.48s elapsed)
  EXIT    time    0.00s  (  0.00s elapsed)
  Total   time    8.11s  (  8.11s elapsed)

  %GC     time      43.5%  (42.9% elapsed)

  Alloc rate    9,651,194,755 bytes per MUT second

  Productivity  56.5% of total user, 56.4% of total elapsed

The most obvious first step is to increase the GC default area to try to remove the need for resizing. One trick, for example, is to increase the -A area ( You can use tools like GC tune to find the right settings for your program).

  $ ./A ... +RTS -s -A200M

  Total   time    7.89s  (  7.87s elapsed)

  %GC     time      26.1%  (26.5% elapsed)

  Alloc rate    7,581,233,460 bytes per MUT second

  Productivity  73.9% of total user, 74.1% of total elapsed

so we shave a quarter of a second off, but increased productivity to 75%. Now we should look at the heap profile:

enter image description here

Which shows linear growth of the set and its Int values. This is what your algorithm specifies though, so I don't see a lot you can do, as long as you're retaining all the results.

Community
  • 1
  • 1
Don Stewart
  • 137,316
  • 36
  • 365
  • 468
2

One thing that you're doing a lot is constructing ByteStrings through your use of the binary package (you can use cereal by the way if you want to avoid that to/from lazy chunks). If you dig into the internals of the Builder monad they use, you can see that it has a default initial size of about 32k. For your purposes this is probably putting more pressure than needed on the garbage collector, considering you just need 8 bytes.

Since you're really just using binary for the encoding, you could just do it yourself with something like:

encodeInt64 :: Int64 -> B.ByteString
encodeInt64 x = 
  let 
    go :: Int -> Maybe (Word8, Int)
    go i 
      | i < 0     = Nothing
      | otherwise = 
        let 
          w :: Word8
          w = fromIntegral (x `shiftR` i)
        in Just (w, i-8)
  in fst $ B.unfoldrN 8 go 56

I would hazard that you can even do better perhaps poking the bytes directly into a buffer.

The above is one thing, the other non-GC related point is that you're using the standard Data.Set implementation, which you can find slightly better performance with Data.HashSet from unordered-containers.

The last point, also mentioned by Don is that you can request for a larger allocation area with -A200M (or there-abouts).

With all of the above modifications (your own encoder, using Data.HashSet, and -A200M), the runtime of your code goes from 7.397s to 3.474s on my machine, with %GC time of 52.9% and 21.2% respectively.

So there's nothing you're doing wrong in the Big-O sense of your approach, but there are some constants you can bring down a bit!

ScottWest
  • 1,936
  • 1
  • 13
  • 18
1

I'm not sure. But, here's some profiler output in case someone can construct a real answer from it:

Here's the heap profile (from running with +RTS -hT)

heap profile

I think you're building up thunks in firstCollision due to the unforced evaluation of Set.insert. But, the memory allocation is so small in absolute terms that I'm not sure that it's the real culprit - see below.

Here's output from the profiler (compile with -prof -fprof-auto, run with +RTS -p):

COST CENTRE         MODULE  %time %alloc

firstCollision.go   Main     49.4    2.2
t50.h               Main     39.5   97.5
str2int             Main      5.4    0.0
firstCollision.go.y Main      3.4    0.0
t50                 Main      1.1    0.0

Essentially all of the memory allocation is coming from the local equivalent h of the serializing/hashing pipeline sha256, where there seems to be a lot of intermediate data structure construction going on.

Can any seasoned folks more accurately pinpoint the problem?

jtobin
  • 3,253
  • 3
  • 18
  • 27
  • 2
    If there were unevaluated thunks, they should appear with type `THUNK`. This memory profile looks pretty good to me, at least for this algorithm. – John L May 24 '12 at 10:05