8

I am trying to have free scales on a Boxplot image with faceting.

Using this example dataset, if I try this:

ggplot(data=mpg) +
geom_boxplot(aes(x=cty, y=model))+
facet_grid(manufacturer ~ drv, scales = "free", space = "free")

Plot incorrect boxplot http://dl.dropbox.com/u/9788680/plot1.png

Here, the free scales are implemented exactly as I would like, with the different scales for the y-axis depending on the number of available factors for a horizontal facet rule. The boxplots are however not correctly depicted (i.e. as solid lines instead of boxplots). When searching for a solution, I found that I should use coord_flip() in order to make the boxplot be depicted correctly, i.e.
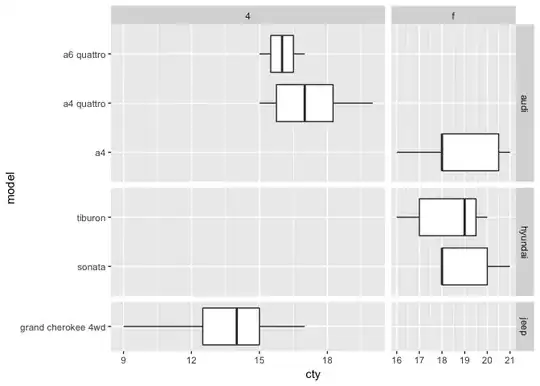
ggplot(data=mpg) +
geom_boxplot(aes(x=model,y=cty))+
facet_grid(manufacturer ~ drv, scales = "free", space = "free")+
coord_flip()

Plot correct boxplot, but no scaling http://dl.dropbox.com/u/9788680/plot2.png

In above picture, the boxplots are now correct. However, the free scale for the factors (so on the y-axis) are removed. Now, for each horizontal facet line, ALL the available factors across the dataset are now included, instead of only the factors available for each facet (as in Figure 1).

I would like to know how I can get the correct facetting with a free scale on both axes, correctly depicting the boxplot.

If somebody could point me in the right direction, I would be grateful.

Thanks.

Brian Diggs
  • 57,757
  • 13
  • 166
  • 188
coenvh
  • 81
  • 1
  • 6
  • I noticed the same problem when answering [http://stackoverflow.com/a/10729264/1385941](http://stackoverflow.com/a/10729264/1385941). My guess is it because `coord_flip()` calls `coord_cartesian` not `scale_continuous`. `scale_` and `coord_` affect the plot differently. It might be worth reporting this as an `issue` at [https://github.com/hadley/ggplot2](https://github.com/hadley/ggplot2) – mnel May 24 '12 at 12:07
  • Thank you for this comment. Hopefully somebody can provide a workaround. If no other comments are posted I will report this issue as suggested. Maybe an analog to geom_errorbarh could be written for boxplots as well. – coenvh May 24 '12 at 13:30
  • There is no current workaround; boxplots are only vertical (continuous variable is y) and can only be flipped with `coord_flip()`, but that messes up the faceting scales, like you see. See https://groups.google.com/d/msg/ggplot2/u5a1mpnJR7E/XxwXWNDX77MJ – Brian Diggs May 24 '12 at 17:44

2 Answers2

2

The desired behavior is supported at least as of ggplot2 2.2.1.


library(ggplot2)
ggplot(data=mpg[which(mpg$manufacturer %in% c('audi', 'hyundai', 'jeep')),]) +
  geom_boxplot(aes(x=model,y=cty)) +
  facet_grid(manufacturer ~ drv, scales = "free", space = "free") +
  coord_flip()

sessionInfo()
#> R version 3.3.2 (2016-10-31)
#> Platform: x86_64-apple-darwin13.4.0 (64-bit)
#> Running under: OS X El Capitan 10.11.6
#> 
#> locale:
#> [1] en_US.UTF-8/en_US.UTF-8/en_US.UTF-8/C/en_US.UTF-8/en_US.UTF-8
#> 
#> attached base packages:
#> [1] stats     graphics  grDevices utils     datasets  methods   base     
#> 
#> other attached packages:
#> [1] ggplot2_2.2.1
#> 
#> loaded via a namespace (and not attached):
#>  [1] Rcpp_0.12.11         digest_0.6.12        rprojroot_1.2       
#>  [4] plyr_1.8.4           grid_3.3.2           gtable_0.2.0        
#>  [7] backports_1.0.5      magrittr_1.5         evaluate_0.10.1     
#> [10] scales_0.4.1.9002    rlang_0.1.1.9000     stringi_1.1.5       
#> [13] reshape2_1.4.2       lazyeval_0.2.0       rmarkdown_1.6.0.9001
#> [16] labeling_0.3         tools_3.3.2          stringr_1.2.0       
#> [19] munsell_0.4.3        yaml_2.1.14          colorspace_1.3-2    
#> [22] htmltools_0.3.6      knitr_1.16           tibble_1.3.3
Dylan
  • 745
  • 8
  • 10
0

I noticed yesterday independently that horizontal bxoplots shows as lines - I am not sure yet if it is a bug, or a feature, or it it ca be changed

in your case, I did this

library(ggplot2)
ggplot(data=mpg) +
  geom_boxplot(aes(y=cty, x=model,fill=model))+
  facet_grid(manufacturer~drv, scales = "free", space = "free")+theme(axis.text.x=element_text(angle=90),legend.position="none")

just reversed x and y, and also the facets=_grid call, added some color and rotated x labels - I think this is what you want just flipped

user1617979
  • 2,370
  • 3
  • 25
  • 30
  • I tried your example, but in this case these are *vertical* boxplots! This is not the plot that I wanted to generate. I was trying to get horizontal boxplots, not vertical. So basically the first example in my post but then getting the actual boxplots, not these lines... – coenvh Feb 17 '14 at 08:19
  • It has been explained that ggplot does not do horizontal box plots, I was showing you how you can create a very similar version just flipped – user1617979 Feb 17 '14 at 11:52
  • 1
    Yes, from previous comments this apparent ggplot limitation became clear. However still, my question was about vertical boxplots... so your suggestion, although appreciated, does not really solves my problem :) – coenvh Feb 17 '14 at 16:00