4

I have a bunch of "simple" images and I want to compare if they are similar together. I compare them to each other using template matching (cv::matchTemplate) and results are quite good.

Now I want to fine tune my program and I face a problem. For example I have two images which look very much alike. Only differences they have is that another one has thicker line and the digit front of item is different. When both images are small, one pixell difference in line thickness makes big result differences when doing template matching. When line thicknesses are same and only difference is the front digit, I get template matching result something like 0.98 with CV_TM_CCORR_NORMED when match successful. When line thickness is different matching result is something like 0.95.

I cannot decrease my threshold value below 0.98 because some other similar images have same line thickness.

Here are example images:

enter image description here enter image description here

So what options do I have?

I have tried:

  • dilate the original and template
  • erode also both
  • morphologyEx both
  • calculating keypoints and comparing them
  • finding corners

But no big success yet. Are those images too simple that detecting "good features" is hard?

Any help is very wellcome.

Thank you!

EDIT:

Here are some other example images. What my program consider as similar are put in same zip-folder. ZIP

iiro
  • 3,132
  • 1
  • 19
  • 22
  • It actually depends on how your other images are, can you include some more distinct examples ? It could be the case that you don't even need to perform cross-correlation, a simple distance measure might suffice. For these two images, for example, using a normalized squared euclidean distance I get ~0.44, while using earth movers distance I get ~0.02. With some basic pre-processing, I get ~0 with EMD and about 0.27 with the former. The problem is that EMD might return values ~0 to all your images, depending on how they are -- which I have no idea. – mmgp Jan 18 '13 at 14:18
  • Hey, thanks. I linked a zip-file containing other images. I haven't tried EMD. Gotta try.. – iiro Jan 25 '13 at 06:05
  • ok, but what are the misclassifications so I can better understand the problem ? For instance, should images 25.png and 47.png be in the same folder ? Currently they are not. Should images images 25.pgn and 29.png be in different folder ? Currently they are in the same one. – mmgp Jan 25 '13 at 13:55
  • 25 vs 47 in optimal situations yes, they should be in same folder. They are extracted from different source images and that's why they are so different. And yes, you understood correctly, 25 vs 28 vs 29. In that folder is also 54, 55, 56 which are same as 25 and these four should be in another folder. – iiro Jan 25 '13 at 17:27

3 Answers3

3

A possible way might be thinning the two images, so that every line is of one pixel width, since the differing thickness is causing you the main problem with similarity.

The procedure would be to first binarize/threshold the images, then apply a thinning operation on both images, so both are now having the same thickness of 1 px. Then use the usual template matching that you used before with good results.

In case you'd like more details on the thinning/skeletonization of binary images here are a few OpenCV implementations posted on various discussion forums and OpenCV groups:

  1. OpenCV code for thinning (Guo and Hall algo, works with CvMat inputs)
  2. The JR Parker implementation using OpenCV
  3. Possibly more efficient code here (uses OpenCV optimized access methods a lot, however most of the page is in Japanese!)
  4. And lastly a brief overview of thinning in case you're interested.
AruniRC
  • 5,070
  • 7
  • 43
  • 73
2

You need something more elementary here, there isn't much reason to go for fancy methods. Your figures are already binary ones, and their shapes are very similar overall.

One initial idea: consider the upper points and bottom points in a certain image and form a upper hull and a bottom hull (simply a hull, not a convex hull or anything else). A point is said to be an upper point (respec. bottom point) if, given a column i, it is the first point starting at the top (bottom) of the image that is not a background point in i. Also, your image is mostly one single connected component (in some cases there are vertical bars separated, but that is fine), so you can discard small components easily. This step is important for your situation because I saw there are some figures with some form of noise that is irrelevant to the rest of the image. Considering that a connected component with less than 100 points is small, these are the hulls you get for the respective images included in the question:

enter image description here

enter image description here

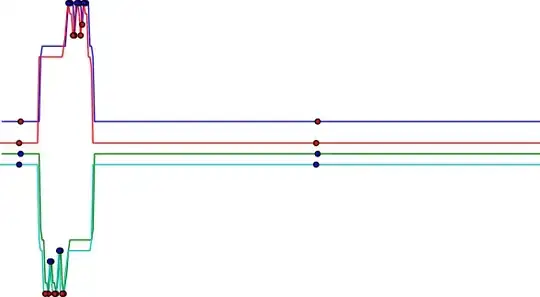
The blue line is indicating the upper hull, the green line the bottom hull. If it is not apparent, when we consider the regional maxima and regional minima of these hulls we obtain the same amount in both of them. Furthermore, they are all very close except for some displacement in the y axis. If we consider the mean x position of the extrema and plot the lines of both images together we get the following figure. In this case, the lines in blue and green are for the second image, and the lines in red and cyan for the first. Red dots are in the mean x coordinate of some regional minima, and blue dots the same but for regional maxima (these are our points of interest). (The following image has been resized for better visualization)

enter image description here

As you can see, you get many nearly overlapping points without doing anything. If we do even less, i.e. not even care about this overlapping, and proceed to classify your images in the trivial way: if an image a and another image b have the same amount of regional maxima in the upper hull, the same amount of regional minima in the upper hull, the same amount of regional maxima in the bottom hull, and the same amount of regional minima in the bottom hull, then a and b belong to the same class. Doing this for all your images, all images are correctly grouped except for the following situation:

enter image description here

enter image description here

In this case we have only 3 maxima and 3 minima for the upper hull in the first image, while there are 4 maxima and 4 minima for the second. Following you see the plots for the hulls and points of interest obtained:

enter image description here enter image description here

As you can notice, in the second upper hull there are two extrema very close. Smoothing this curve eliminates both extrema, making the images match by the trivial method. Also, note that if you draw a rectangle around your images, then this method will tell they are all equal. In that case you will want to compare multiple hulls, discarding the points in the current hull and constructing other ones. Nevertheless, this method is able to group all your images correctly given they are all very simple and mostly noisy-free.

mmgp
  • 18,901
  • 3
  • 53
  • 80
  • Thanks for analyze! Could you point me in right direction what could be best way to extract top and bottom hulls and calculate maxima and minima for every columns ? Should I just go column by column or is there some ready made methods in OpenCV? There is a convexHull-method in OpenCV. Maybe I should try that first. – iiro Jan 26 '13 at 11:22
  • @iiro to extract the top and bottom hulls you can simply go column by column just as described in the answer, it is a very easy method. Then you can marge adjacent points in the same `y` coord, I have this implemented but it is very trivial and I didn't rely on any library (I don't think any would implement that). The convex-hull is very different from what is shown here, but maybe it is possible to use it and do the analysis in a different manner. – mmgp Jan 26 '13 at 12:25
  • @iiro just remembered one thing: this can be easily done with hit-or-miss transform. But this isn't available in OpenCV, so you have to implement that part yourself (which, again, is very easy). – mmgp Jan 26 '13 at 21:22
1

From as much as I can get, the difficulty is when the shape is the same, just size is different. A simple hack approach could be: - subtract the images, then erode. If the shapes were the same but one slightly bigger, subtracting will leave only the edges, which will be thin an vanish with erosion as noise.

Somewhat more formal, would be to take the contours and then the approximate polygons and do a invariants comparison (Hu Moments etc.)

Steve Heim
  • 799
  • 12
  • 25