4

I'm generating a StackedBarChart using JFreeChart. Depending on the input data I can have a lot of categories (usually between 20 and 40), leading to overlapping of the labels. In the following screenshot you can see the chart with categories from 1 to 38:

chart with categories from 1 to 38, overlapping labels

I'd like to show some of the category labels as reference, but not all. It would be perfect to show the first and last, and every fifth inbetween. Is this possible?

I can't change the width of the chart, and making the labels smaller does only work if they are so small that you can't read them anymore... Last resort would be to hide the whole category axis...

Thanks for any suggestions!
moeTi
  • 3,884
  • 24
  • 37
  • In your Customize method use bleow approch to make category label transparent instead of white. CategoryPlot plot = chart.getCategoryPlot(); CategoryAxis domainAxis = plot.getDomainAxis(); for (int i = 1; i <= plot.getCategories().size(); i++) { //write your logic when to hide categories and use below code to hide String cat_Name = (String) plot.getCategories().get(i-1); domainAxis.setTickLabelPaint(cat_Names, new Color(0,0,0,0)); } } – ImI Jun 01 '21 at 13:03

2 Answers2

5

One simple solution is to set the Category lables to the backround colour (in this case white).

    CategoryPlot plot = (CategoryPlot) chart.getPlot();
    CategoryAxis domainAxis = plot.getDomainAxis();
    domainAxis.setTickLabelPaint("Category 2", Color.white);
    domainAxis.setTickLabelPaint("Category 4", Color.white);

This will produce a chart like this

enter image description here

GrahamA
  • 5,875
  • 29
  • 39
  • 2
    probably not the prettiest solution, but it works and I didnt't find a better one. using it now with transparent color ( _new Color(0,0,0,0)_ ) – moeTi Jun 11 '12 at 08:33
  • @moeTi Agreed, Its not the prettiest solution - Another solution is to override getTickLabelPaint but as this still requires use of the category label rather than a decision based on available space. – GrahamA Jun 11 '12 at 09:26
2

You can use setVerticalTickLabels(true) on your domain axis, as shown in this example.

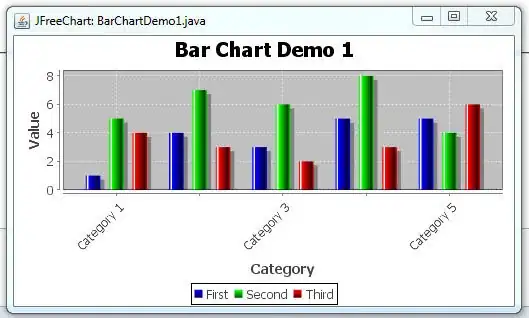
Addendum: Oops, the example cited is for a ValueAxis. For a CategoryAxis, as used in StackedBarChart, you have even more flexility with the method setCategoryLabelPositions(). Typical usage is illustrated in the BarChartDemo1 source, shown here.

Community
  • 1
  • 1
trashgod
  • 203,806
  • 29
  • 246
  • 1,045
  • 1
    yeah I also tried that, but it still doesn't look good because there are just too many categories. the labels are already narrow (1-2 digits), so turning them up or down doesn't really change anything. – moeTi Jun 11 '12 at 08:17