1

I am trying to get an filled binary mask of a contour of this image. The contour of the image

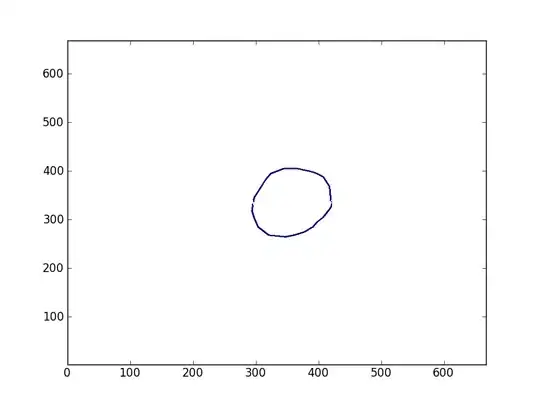
I took a look this question SciPy Create 2D Polygon Mask; however it does not seem to like my set of data.

import numpy as np
from matplotlib.nxutils import points_inside_poly

nx, ny = 10, 10
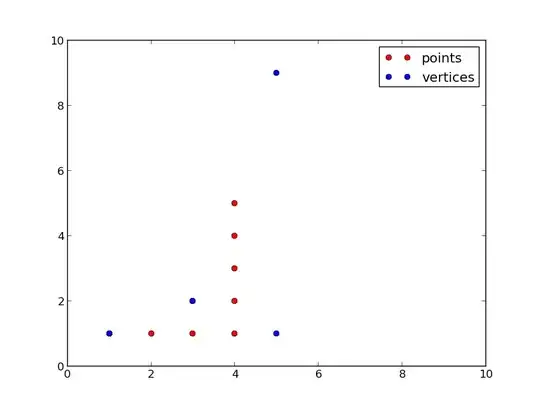
poly_verts = [(1,1), (5,1), (5,9),(3,2),(1,1)]

# Create vertex coordinates for each grid cell...
# (<0,0> is at the top left of the grid in this system)
x, y = np.meshgrid(np.arange(nx), np.arange(ny))
x, y = x.flatten(), y.flatten()

points = np.vstack((x,y)).T

grid = points_inside_poly(points, poly_verts)
grid = grid.reshape((ny,nx))

print grid

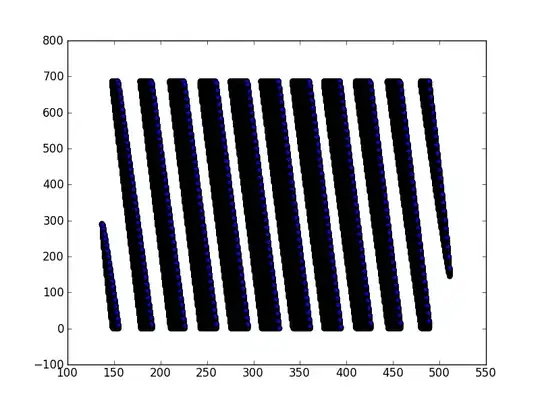
I wonder if there is another way that I can try to return a binary mask or someone to explain the limitations of points_inside_poly

because it seems to end up something like this badMaskScatter

Community
  • 1
  • 1
user1462442
  • 7,672
  • 1
  • 24
  • 27

1 Answers1

2

I'm not sure what you're plotting at the end, but your example works for me:

import numpy as np
import matplotlib.pyplot as plt
from matplotlib.nxutils import points_inside_poly
from itertools import product, compress

pv = [(1,1),(5,1),(5,9),(3,2),(1,1)]

x, y = np.meshgrid(np.arange(10),np.arange(10))
x, y = x.flatten(), y.flatten()

xy = np.vstack((x,y)).T

grid = points_inside_poly(xy,pv)

xv, yv = zip(*pv)
xp, yp = zip(*compress(xy,grid))

plt.plot(xp,yp,'o',color='red',label='points')
plt.plot(xv,yv,'o',color='blue',label='vertices')
plt.xlim((0,10))
plt.ylim((0,10))
plt.legend()
plt.show()

points_inside_poly

user545424
  • 15,713
  • 11
  • 56
  • 70
  • I am using the contour of that image above. The code example is just copy and paste it here, since people dont always feel like clicking links. I really do not understand why I got that image below. Hmmmmm. I guess I have to try and set up my data again because the behavior of points_inside_poly. If you want I can post the rest of my code, but its kidda embrassed because I am trying to learn these libraries – user1462442 Jun 28 '12 at 05:24