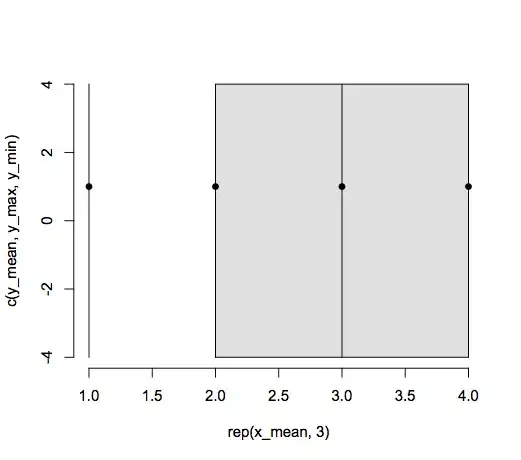
I am trying to make a plot in R that has a portion of the plot grey to emphasize this area. Unlike other examples, I don't want to color an area under a plot, but instead color an area on a plot starting at one area and going to the end of the graph. When I try to use rect() or polygon() it obscures the plots I want to emphasize.
For example:
x_mean <- c(1, 2, 3, 4)
y_mean <- c(1, 1, 1, 1)

y_max <- c(4, 4, 4, 4)
y_min <- c(-4, -4, -4, -4)


x_shade <- c(2, 3, 4)

y_max_shade <- c(4, 4, 4)
y_min_shade <- c(-4, -4, -4)

plot(x=rep(x_mean, 3), y=c(y_mean, y_max, y_min), bty='n', type="n" )
arrows(x0=x_mean, y0=y_min, x1=x_mean, y1=y_max, length=0)
points( x=x_mean, y=y_mean, pch=16)
This will plot 4 lines on the graph. How do I draw a grey box in the background from the 2nd line to the end of the plot?
