1

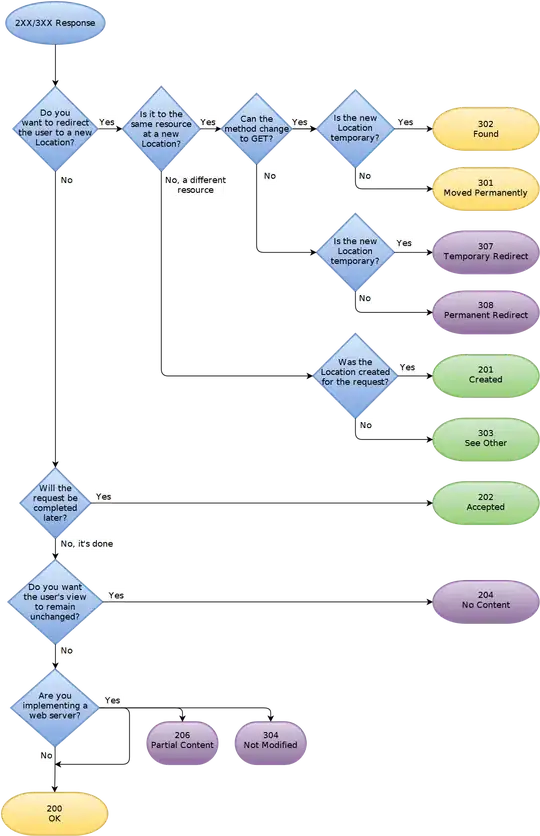
I am stuck in preparing some chart control in the format we required. I have added the asp chart control in to my asp.net application, Where the X and Y values in the chart are displaying correctly, when i pass some values. Right now I want to display the legends along with the unit values in the chart. The following figure is my required format

Required Chart

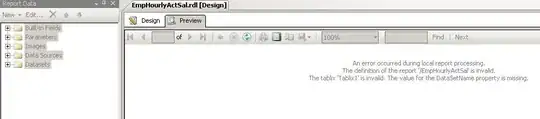
I have searched every where in the net and also tried a lot, but still I dint find the way how can i display the chart like that. For an alternative I added one grid control at the bottom of chart, but its not appearing as my requirement. It is coming differently like below.

Current Chart

So, can any one give me an advice of how can i achieve my goal of displaying the chart like in my required format.

1 Answers1

0

Thank you for not responding to my question, so any how I have done it my self by using datalist at the bottom of the chart control. I added one datalist control to the table in which chart control is present and binded the required data table to the datalist and also binded images to the datalist control at runtime from a datatable. Inorder to display the data present in datalist, i used RepearDirection property of the datalist and set it to "Horizontal". Finally my report displayed like my required format. And for the chart area, i added two types of series for the same X and Y points inorder to display Line chart as I required, one series is bubble and another is line.

So, finally my graph displayed as below.

enter image description here