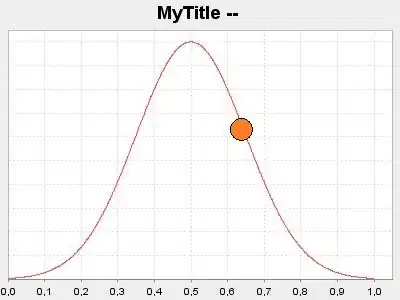
I've drawn a standard normal distribution using JFreeChart:
NormalDistributionFunction2D normalDistributionFunction2D = new NormalDistributionFunction2D(0.5, 0.15);
XYDataset dataset = DatasetUtilities.sampleFunction2D(normalDistributionFunction2D, 0.0, 1.0, 1000, "Normal");
JFreeChart chart = ChartFactory.createXYLineChart("MyTitle --, "", "", xySeriesCollection, PlotOrientation.VERTICAL, false, false, false);
On top of this, I would like to place a circle at a given point. I have no problems with calculating the [x,y] co-ordinates of the circle, but I am unsure as to how I can add it to the chart. Any help appreciated. An MS Paint knockup of what I want to achieve is below.