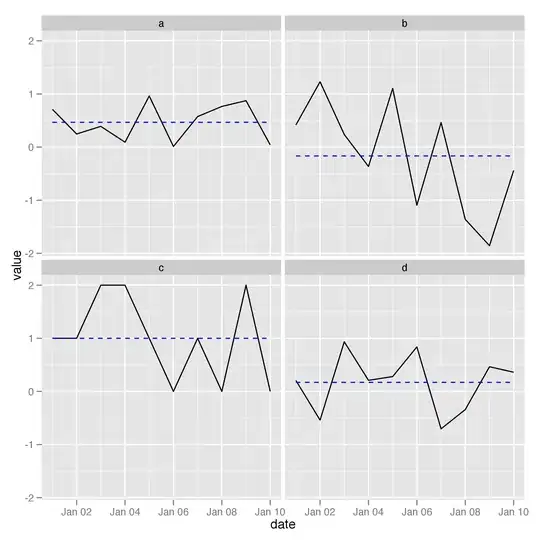
I have the following plot, and I'm trying to
1) add labels to the dashed blue lines to show their value, preferably on the right side of each facet
2) reorder the facets by the mean, so that the facets appear in descending order of mean
require(ggplot2)
require(reshape)
set.seed(13)
df <- data.frame(a=runif(10), b=rnorm(10), c=rbinom(10, 10, 0.1),
             d=runif(10, -1, 1), date=as.Date("2000-01-01") + 0:9)
df <- melt(df, id=c('date'))

g <- ggplot(df, aes(date, value)) + geom_line() + facet_wrap(~variable)
g <- g + geom_line(stat='hline', yintercept='mean', color='blue', linetype=2)