3

Related: Order Bars in ggplot2 bar graph. That question deals with re-ordering based on some numerical characteristic (e.g. greatest to least). I want to re-order based on an arbitrary reason not inherent to the data.

Also, how to change the order of a discrete x scale in ggplot?. This suggests ordering the factor levels, which I've done below, however I can't seem to combine the act of subsetting the data and keeping the factor order I want.


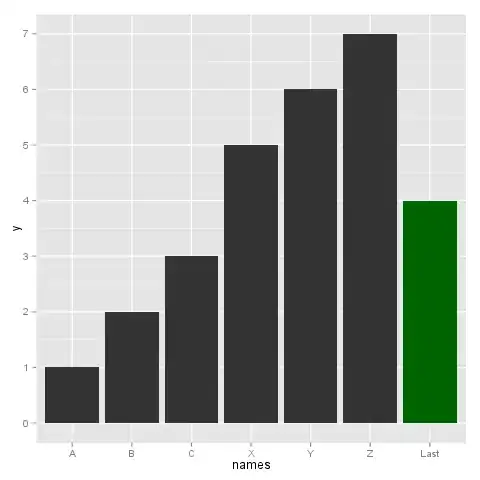
I have some product test data and I'd like to make a particular sample stand out in my bar charts. In my particular case, I want to push my sample of interest all the way to one side and color it differently (i.e. move my highlighted sample to the right out of alphabetical order and have it be green).

Here's an example of what I tried to do:

library(ggplot2)
test <- data.frame(names = c("A", "B", "C", "Last", "X", "Y", "Z"))
test$y <- 1:7

If I plot this as is, the factors, as we all know, will be arranged alphabetically.

ggplot(test, aes(x=Names, y=y)) + geom_bar()

enter image description here

I rearranged the levels like so:

test$names <- factor(test$names, levels = test$names[ c(1:3, 5:7, 4) ])
test$names
[1] A    B    C    Last X    Y    Z   
Levels: A B C X Y Z Last

So far so good. If we plot now, I get this, which gives me the order I want:

ggplot(test, aes(x=names, y=y)) + geom_bar()

enter image description here

But I'd like to color Last green, so I tried this:

p <- ggplot(test[!test$names=="Last" ,], aes(x=names, y=y)) + geom_bar()
p <- p + geom_bar(aes(x=names, y=y), test[test$names=="Last" ,], fill="darkgreen")
p

enter image description here

If we look at my in situ subsets passed to ggplot:

test[!test$names=="Last" , ]$names
[1] A B C X Y Z
Levels: A B C X Y Z Last

test[!test$names=="Last" , ]$names
[1] A B C X Y Z
Levels: A B C X Y Z Last

So the level ordering is correct but ggplot's not using that to determine plot order.

I wondered if the issue was the plot data coming from the same data frame, so I split them wondering if ggplot would append the separate data to the end:

test2 <- test[test$names=="Last" , ]
test <- droplevels(test)
test2 <- droplevels(test2)
p <- ggplot(test, aes(x=names, y=y)) + geom_bar()
p <- p + geom_bar(aes(x=names, y=y), test2, fill="darkgreen")
p

The result is the same as the last graph, with Last in the middle.

Lastly, I thought this might be done via scale_x_discrete, so I tried this:

p <- ggplot(test[!test$names=="Last" ,], aes(x=names, y=y)) + geom_bar()
p <- p + geom_bar(aes(x=names, y=y), test[test$names=="Last" ,], fill="darkgreen")
p <- p + scale_x_discrete(breaks=test$names[c(1:3, 5:7, 4)])
p

I still get Last in the middle.

Questions

  • Why is ggplot reverting to alphabetical plot order instead of looking to the factor level ordering?
  • Is there another (or better way) to single out a row for "special treatment" in a plot?
Community
  • 1
  • 1
Hendy
  • 10,182
  • 15
  • 65
  • 71

2 Answers2

5

Two other ways to get what you want:

  1. Use scale_x_discrete(drop=FALSE) This is necessary because the two sets of data you are using don't have the same x values present despite the levels() of the factors being the same.

    p <- ggplot(test[!test$names=="Last" ,], aes(x=names, y=y)) + geom_bar()
    p <- p + geom_bar(aes(x=names, y=y), test[test$names=="Last" ,], fill="darkgreen")
    p <- p + scale_x_discrete(drop = FALSE)
    p
    
  2. Color (well, fill) with a derived aesthetic and map that

    ggplot(test, aes(x=names,  y=y, fill=(names=="Last"))) +
      geom_bar() +
      scale_fill_manual(breaks = c(FALSE,TRUE), 
                        values = c("black", "darkgreen"),
                        guide = "none")
    

Both give a graph that looks just like the one in your answer.

Brian Diggs
  • 57,757
  • 13
  • 166
  • 188
  • Could you expand on "don't have the same sets of levels"? `levels()` provided the same set for both data subsets using `test[criteria=="", ]`. I really like the second solution. I didn't know one could do that. So the fill vector ends up being a vector of T/F values and then you tell ggplot how to map color to T/F? Is there a way to do this outside `aes()` so one doesn't have to pass a `guide="none"`? Thanks for this! – Hendy Jul 21 '12 at 19:23
  • I phrased that poorly. The factors do have the same `levels()`, as you point out. The values that are actually present, however, are not the same. As for your second question, it must be inside an `aes()` call because the colour/fill is being determined by the data, not being assigned a constant value. If it is data-driven, then it must be inside an `aes()`. – Brian Diggs Jul 23 '12 at 15:24
  • 1
    Thanks for the explanation. Feeling rather silly, I realize I could also create a new vector in the df with some sort of fill value (duh) and just set it to that. You're doing it in situ which is neat. Thanks again! – Hendy Jul 23 '12 at 15:43
  • One last (hopefully) question. Is `fill=` outside of `aes()` only allowed to contain one value? I ask as what if fill isn't determined by the data but by manual entering, like `ggplot(dat, aes(x=x, y=y), fill=c(rep("black", 6), "darkgreen"))`. That doesn't appear to work, so I'm thinking providing `fill=` with a specific value only works 1) outside of `aes()` and 2) only if all bars are to have the same value. Is that correct? – Hendy Jul 25 '12 at 20:34
  • Outside of an `aes()`, any aesthetic is only allowed to take a single value which is what it will be for all (points/bar/whatever) of the graph. So, yes to both 1 and 2. If you specify multiple values, you have an implicit relationship between those values and your data; ggplot requires this relationship be explicit (in the data.frame). – Brian Diggs Jul 26 '12 at 14:29
  • Perfect. Thanks again for the explanations. I figured this was the case, as trying to pass a vector got an error about multiple values outside of `aes()`. – Hendy Jul 26 '12 at 16:13
3

Sigh...

The answer was in the second related question above (how to change the order of a discrete x scale in ggplot?), but further down and not accepted. The manual way to do this is via scale_x_discrete, but I thought breaks= was the way. It's actually using limits=.

The proper code to do what I was looking for is:

p <- ggplot(test[!test$names=="Last" ,], aes(x=names, y=y)) + geom_bar()
p <- p + geom_bar(aes(x=names, y=y), test[test$names=="Last" ,], fill="darkgreen")
p <- p + scale_x_discrete(limits=test$names[c(1:3, 5:7, 4)])
p

Or, since I'd already rearranged the levels:

p <- ggplot(test[!test$names=="Last" ,], aes(x=names, y=y)) + geom_bar()
p <- p + geom_bar(aes(x=names, y=y), test[test$names=="Last" ,], fill="darkgreen")
p <- p + scale_x_discrete(limits=levels(test$names))
p

enter image description here

Community
  • 1
  • 1
Hendy
  • 10,182
  • 15
  • 65
  • 71