I call a method in Visual Studio and attempt to debug it by going over the call stack.
Some of the rows in it are marked "External code".
What exactly does this mean? Methods from a .dll have been executed?
I call a method in Visual Studio and attempt to debug it by going over the call stack.
Some of the rows in it are marked "External code".
What exactly does this mean? Methods from a .dll have been executed?
[External code] means that there is no debugging information available for that dll.
What you can do is in Call Stack window click right mouse button. Then select Show External Code this will expand [External Code] and will show you modules that are being called.
once you get it expanded you will see dll's that are being called you can get locations on disk by clicking on Symbol Load Information...
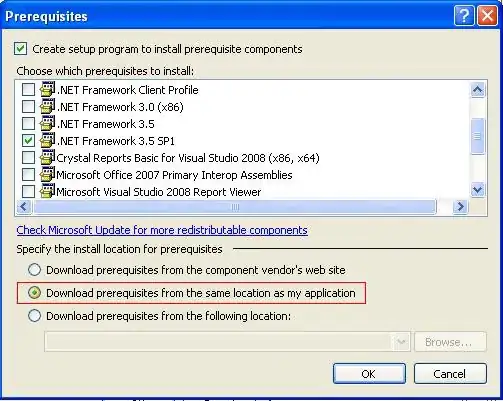
This will open dialog that shows locations on disk

If you want to debug these external files you need to get .pdb files for dll's and place in same folder as .dll
this should allow you to Load symbols (menu in screenshot 2 above Symbol Load Information) and start debugging.
More on getting .pdb files here.
And here's an actual example of EF .pdb being generated
Hope this saves you some time.
These are the lines where symbol information is not currently available for Visual Studio Debugger. In other words Debugger is not able to retrieve code from the line executed.
I wrote currently because the symbol information can be downloaded or setup.
For more information you can read this : How to: Specify Symbol Locations and Loading Behavior
The notation 'External Code' refers to everything that does not belong to 'My Code'.
That's the way it is described in the MSDN documentation here How to: Use the Call Stack Window
In managed code, by default. the Call Stack window hides information for non-user code. > The following notation appears instead of the hidden information.
<[External Code]>
Non-user code is any code that is not "My Code."`
Your Code is as you might have thought everything you did write on your own. So with this definition everything that belongs to external dll's is omitted in the trace of the call stack.
Furthermore according to How to: Step Into Just My Code you have the possibility to deny the debugger to try to trace non-user code.
Here you will find the explanation for what user code actually is:
To distinguish user code from non-user code, Just My Code looks at three things: DBG Files, PDB files, and optimization.
Those lines are not referenced by the debug symbols that you currently have loaded.
This code may be part of an external DLL, or native code inside the CLR. If you know which module it is, and have debug symbols for them, you can load them into Visual Studio manually.
Methods you do not have code / symbols for. Like .NET framework or 3rd party assemblies.
you can use the Attach to Process action on the Debug menu to debug running instance of your host app. (running process has the debug symbols .pdb files ).