19

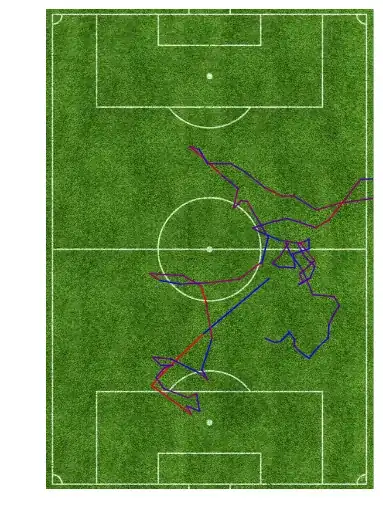
I am plotting an image in matplotlib, and it keeps giving me some padding. This is what I have tried:

def field_plot():
    x = [i[0] for i in path]
    y = [i[1] for i in path]
    plt.clf()
    plt.axis([0, 560, 0, 820])
    im = plt.imread('field.jpg')
    field = plt.imshow(im)
    for i in range(len(r)):
        plt.plot(r[i][0],r[i][1],c=(rgb_number(speeds[i]),0,1-rgb_number(speeds[i])),linewidth=1)
    plt.axis('off')
    plt.savefig( IMG_DIR + 'match.png',bbox_inches='tight', transparent="True")
    plt.clf()

This is how i see the image

andresmechali
  • 705
  • 2
  • 7
  • 18
  • Where in the image is the padding you're referring to? Also, your example is not very useful since we can't run it without your image file. – BrenBarn Jul 24 '12 at 19:29
  • @BrenBarn On the left and below the image are the biggest paddings. Above and on the right I have smaller paddings. It's like if it leaves space for labels and so – andresmechali Jul 24 '12 at 19:32
  • 1
    Can you provide a runnable example that doesn't rely on external files? Also see previous questions [here](http://stackoverflow.com/questions/3130072/matplotlib-savefig-image-trim) and [here](http://stackoverflow.com/questions/9295026/matplotlib-plots-removing-axis-legends-and-white-spaces). If those don't work, please explain what they don't do that you need them to do. – BrenBarn Jul 24 '12 at 19:33
  • @BrenBarn I am very new to this, so I don't know how to provide a better example for this.. I am very sorry, I don't know how to think it without the images.. :( – andresmechali Jul 24 '12 at 19:42
  • You mind attaching the image so we can see what you talking about? Also, maybe your code should be a bit more complete (e.g. I don't know what `r` is, beyond mere guessing). – tshepang Jul 24 '12 at 20:10
  • 1
    @Tshepang I have attached the image as it is saved. As you may see if you download it, it has white big paddings. r is a list, which has [x,x+1],[y,y+1] for every point (the coordinates of each plot) – andresmechali Jul 24 '12 at 20:40

5 Answers5

25

Try using pad_inches=0, i.e.

plt.savefig( IMG_DIR + 'match.png',bbox_inches='tight', transparent="True", pad_inches=0)

From the documentation:

pad_inches: Amount of padding around the figure when bbox_inches is ‘tight’.

I think the default is pad_inches=0.1

Keith Flower
  • 4,032
  • 25
  • 16
  • 4
    The quotes are not needed around True; transparent=True. The reason being transparent="False" also translates to transparent=True. – nvd Jun 25 '14 at 18:21
8

Just add plt.tight_layout() before plt.savefig() !!

plt.figure(figsize=(16, 10))

# ... Doing Something ...

plt.tight_layout()
plt.savefig('wethers.png')
plt.show()
SHIM
  • 101
  • 1
  • 3
5

This worked for me. After plotting, get the Axes object from plt using ax = plt.gca(). Then set the xlim, and ylim of ax object to match image width and image height. Matplotlib seems to automatically increase xlim and ylim of viewing area when you plot. Note that while setting y_lim you have to invert the order of coordinates.

for i in range(len(r)):
  plt.plot(r[i][0],r[i][1],c=(rgb_number(speeds[i]),0,1-rgb_number(speeds[i])),linewidth=1)

plt.axis('off')
ax = plt.gca();
ax.set_xlim(0.0, width_of_im);
ax.set_ylim(height_of_im, 0.0);
plt.savefig( IMG_DIR + 'match.png',bbox_inches='tight', transparent="True")
Sasi Inguva
  • 51
  • 1
  • 1
3

All previous approaches didn't quite work for me, they all left some padding around the figure.

The following lines successfully removed the white or transparent padding that was left:

plt.axis('off')
ax = plt.gca()
ax.xaxis.set_major_locator(matplotlib.ticker.NullLocator())
ax.yaxis.set_major_locator(matplotlib.ticker.NullLocator())
plt.savefig(IMG_DIR + 'match.png', pad_inches=0, bbox_inches='tight', transparent=True)
Guillem Cucurull
  • 1,681
  • 1
  • 22
  • 30
3

Use plt.gca().set_position((0, 0, 1, 1)) to let the axes span the whole figure, see reference. If plt.imshow is used, this requires that the figure has the correct aspect ratio.

import matplotlib as mpl
import matplotlib.pyplot as plt

# set the correct aspect ratio
dpi = mpl.rcParams["figure.dpi"]
plt.figure(figsize=(560/dpi, 820/dpi))

plt.axis('off')
plt.gca().set_position((0, 0, 1, 1))

im = plt.imread('field.jpg')
plt.imshow(im)

plt.savefig("test.png")
plt.close()