I've got some unit tests, and got some code coverage data. Now, I'd like to be able to view that code coverage data outside of visual studio, say in a web browser. But, when I export the code coverage to an xml file, I can't do anything with it. Are there readers out there for this? Do I have to write an xml parser and then display it how I want it (seems like a waste since visual studio already does this.) Seems kinda silly to have to take a screenshot of my code coverage results as my "report" Suggestions?
7 Answers
This tool https://github.com/danielpalme/ReportGenerator quickly generate Html reports from coverage file. Works quite well and does not require complex activities, can be easily included in the build process.
- 920
- 7
- 19
- 4,102
- 5
- 29
- 32
There is this tool called Visual Coverage (https://github.com/jsargiot/visual-coverage). It takes a .coverage file as input and can export it to clover or html.
The page on github shows how to execute and if you're curious you can take a look at the code...
- 8,021
- 7
- 40
- 48
- 71
- 3
-
Be aware that visual-coverage doesn't output correct values for C++ projects – TomSmartBishop Dec 08 '17 at 15:59
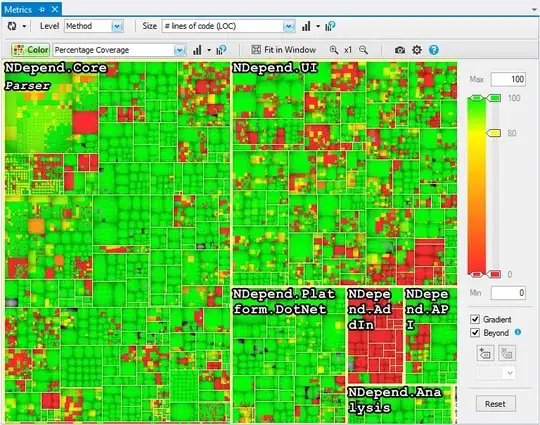
You can use the tool NDepend and visualize code coverage results imported from NCover, dotCover or Visual Studio coverage. The tool can show code coverage vs. lines of code in a colored treemap. This feature is especially useful to browse at a glance which portion of code is well covered or not by tests.
You can also write and apply continuously code rules written over LINQ queries (CQLinq) like:
From now, all types added or refactored should be 100% covered by tests
// <Name>From now, all types added or refactored should be 100% covered by tests</Name>
warnif count > 0 from t in JustMyCode.Types where

  // Match methods new or modified since Baseline for Comparison...
  (t.WasAdded() || t.CodeWasChanged()) &&

  // ...that are not 100% covered by tests
  t.PercentageCoverage < 100

  let methodsCulprit = t.Methods.Where(m => m.PercentageCoverage < 100)

select new { t, t.PercentageCoverage, methodsCulprit }
...or also:
- Types that used to be 100% covered but not anymore
- C.R.A.P method code metric
- Complex methods partially covered by tests should be 100% covered
The panel Search by Coverage can generate such Code Query over LINQ, and displays instantly the matched code elements:

Also, the tool can build a HTML/javascript reports that will show code rules violated or code queries results.
- 13,237
- 6
- 61
- 92
Now you can use the tool of dotnet for generate the report in html
dotnet tool install -g dotnet-reportgenerator-globaltool
reportgenerator
"-reports:Path\To\TestProject\TestResults\{guid}\coverage.cobertura.xml"
"-targetdir:coveragereport"
-reporttypes:Html
- 31,987
- 4
- 37
- 63
- 21
- 1
Might help: you can open all the coverage data in the Code Coverage Results pane and copy&paste it to Excel...
- 185
- 1
- 11
-
This doesn't apply to Visual Studio Professional, where Code Coverage feature is not included – JacobE Jan 18 '13 at 07:39
-
2
I can't speak for the content of the exported XML, but I'd expect it contain your coverage data as a summary.
The usual thing to do with XML data like this if you want to see it in a web browser page is to convert it to HTML by writing and running a custom XSLT script. This will presumably get you HTML text and tables containing your data.
If you want to see the coverage data as decorations imposed on the source code, I think you have a much harder problem.
- 93,541
- 22
- 172
- 341
I use NCover to do all my code coverage and you have the ability to export the results quite easily
- 22,188
- 7
- 49
- 62
