Can I adjust the point size, alpha, font, and axis ticks in a plotmatrix?
Here is an example:
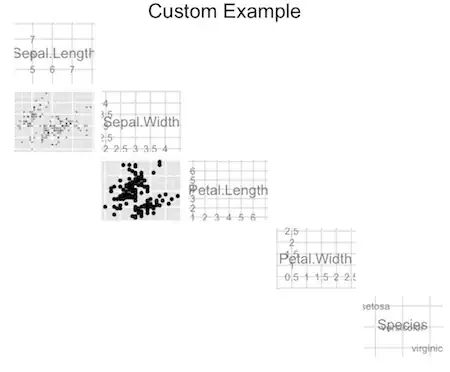
library(ggplot2)
plotmatrix(iris)

How can I:
- make the points twice as big
- set alpha = 0.5
- have no more than 5 ticks on each axis
- set font to 1/2 size?
I have fiddled with the mapping = aes() argument to plotmatrix as well as opts() and adding layers such as + geom_point(alpha = 0.5, size = 14), but none of these seem to do anything. I have hacked a bit of a fix to the size by writing to a large pdf (pdf(file = "foo.pdf", height = 10, width = 10)), but this provides only a limited amount of control.