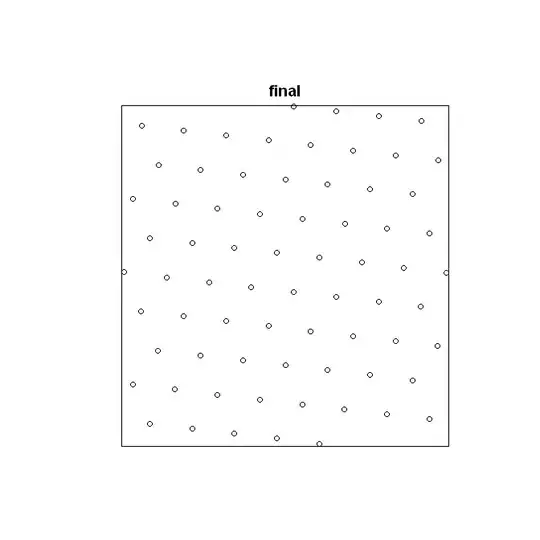
I'm analyzing the growth pattern of certain particles, and want to compare the point pattern with that of a perfectly hexagonal lattice with the same intensity (same number of points per unit of area). I've written a function that does this, but it has an inherent error and I'm not sure from where it originates. Essentially, after the function has run its course, it produces a perfectly hexagonal point pattern that does NOT have the correct number of particles - it is usually off by about 1-4%. If you copy and paste the following code into R, you'll see this - for this particular example, the error is 11.25% - the original point pattern has 71 particles and the perfectly hexagonal point pattern that was generated has 80 particles. This seems very odd, since the code, as you will see, is designed to place the particles a specific distance from one another, thereby creating a window of the same size as the original with the same number of particles.
The following is the code for the function I wrote to generate the hexagonal lattice.
library(spatstat)

data(swedishpines)

swedishpines.df <- as.data.frame(swedishpines)

MaxXValue <- max(swedishpines.df[1])
MaxYValue <- max(swedishpines.df[2])
#The above two lines dictate the window size
NumberOfParticles <- nrow(swedishpines.df[1])
#Number of entries = number of particles

#calculate delta
intensity <- NumberOfParticles / (MaxXValue*MaxYValue)
#Intensity ---> particles / unit^2
    #Area = ( sqrt(3) / 2 ) * delta^2
    #Now - in substituting intensity in for area, it is key to recognize
    #that there are 3 particles associated with each hexagonal tile.
    #This is because each particle on the border of the tile is really 1/3 of a
    #a particle due to it being associated with 3 different hexagonal tiles.
    #Since intensity = 3 Particles / Area,
delta <- sqrt(2/(intensity*(sqrt(3))))
#This is derived from the equation for the area of a regular hexagon.

#xcoords and ycoords represent the x and y coordintes of all of the generated points.  The 'x' and 'y' are temporary holders for the x and y coordinates of a single horizontal line of points (they are appended to xcoords and ycoords at the end of each while loop).

xcoords <- c()
ycoords <- c()

#The following large while loop calculates the coordinates of the first set of points that are vertically aligned with one another. (alternating horizontal lines of particles)  This is shown in the image below.

y_shift <- 0
while (y_shift < MaxYValue) {

    x <- c(0)
    x_shift <- 0 + delta
    count <- 0

    while (x_shift < MaxXValue) {
        x <- append(x, x_shift)
        x_shift <- x_shift + delta
        count <- count + 1
    }

    y <- c(y_shift)

    for (i in seq(0,(count-1))) {
        y <- append(y, y_shift)
    }

    y_shift <- y_shift + sqrt(3)*delta
    xcoords <- append(xcoords,x)
    ycoords <- append(ycoords,y)

}

#The following large while loop calculates the coordinates of the second set of points that are vertically aligned with one another. This is shown in the image below.

y_shift <- 0 + (delta*(sqrt(3)))/2
while (y_shift < MaxYValue) {

    x <- c(0 + (1/2)*delta)
    x_shift <- 0 + (1/2)*delta + delta
    count <- 0

    while (x_shift < MaxXValue) {
        x <- append(x, x_shift)
        x_shift <- x_shift + delta
        count <- count + 1
    }

    y <- c(y_shift)

    for (i in seq(0,(count-1))) {
        y <- append(y, y_shift)
    }

    y_shift <- y_shift + sqrt(3)*delta
    xcoords <- append(xcoords,x)
    ycoords <- append(ycoords,y)

}

hexplot <- ppp(xcoords, ycoords, window=owin(c(0,MaxXValue),c(0,MaxYValue)))

Now, I'm relatively new to R, so it may very well be a syntax error somewhere in the code that has caused this error. Or, it may be that I have some fault in my train of thought with this process. However, I don't think that is likely, since my results have been quite close to what I've been trying for (only 1-4% error most of the time is fairly good).
In summary, what I would like help with is how to take a point pattern and create another point pattern of the same window size with the same number of particles, but a perfectly hexagonal point pattern.
Please don't hesitate to ask me to elucidate anything if you feel that something is unclear.
Thanks!
