41

As I interact with my AJAX based application at RUNTIME I'd like the console to spit out all the functions it's calling. (so no stack trace, or breakpoints, or profiling or anything)

So for example, let's say I pressed a button on the page. I'd like for it to return all the functions it went through when that happened:

So I'd see in the console something like (when I pressed a button):

1. button1Clicked();
2.     calculating();
3.          printingResults();

Which basically means that button1Clicked() called calculating() which called printingResults()

Is there a utility, or plugin, browser, or maybe some way in the language to do this? I'm using google chrome, btw.

p.s and NO I do not want to go through each function and add a "console.log("inside function X")" b/c that's too much work

p.p.s as an added bonus I'd like to see the arguments passed into the functions too, but maybe that's pushing it. :>

Shai UI
  • 50,568
  • 73
  • 204
  • 309
  • 9
    Well, you can use [`console.trace()`](https://developers.google.com/chrome-developer-tools/docs/scripts-exceptions) in *one* place instead of `console.log` in many places. The stack will then appear in the developer tools. Is that an acceptable solution? – vcsjones Aug 07 '12 at 20:11

9 Answers9

40

I can't think of a great way to intercept all function calls globally to insert logging (though there is a decent workaround in the update section below).

Instead, how about only adding logging to functions in a certain namespace that you care about? You can do this with the following setup code:

var functionLogger = {};

functionLogger.log = true;//Set this to false to disable logging 

/**
 * Gets a function that when called will log information about itself if logging is turned on.
 *
 * @param func The function to add logging to.
 * @param name The name of the function.
 *
 * @return A function that will perform logging and then call the function. 
 */
functionLogger.getLoggableFunction = function(func, name) {
    return function() {
        if (functionLogger.log) {
            var logText = name + '(';

            for (var i = 0; i < arguments.length; i++) {
                if (i > 0) {
                    logText += ', ';
                }
                logText += arguments[i];
            }
            logText += ');';

            console.log(logText);
        }

        return func.apply(this, arguments);
    }
};

/**
 * After this is called, all direct children of the provided namespace object that are 
 * functions will log their name as well as the values of the parameters passed in.
 *
 * @param namespaceObject The object whose child functions you'd like to add logging to.
 */
functionLogger.addLoggingToNamespace = function(namespaceObject){
    for(var name in namespaceObject){
        var potentialFunction = namespaceObject[name];

        if(Object.prototype.toString.call(potentialFunction) === '[object Function]'){
            namespaceObject[name] = functionLogger.getLoggableFunction(potentialFunction, name);
        }
    }
};

Then, for whatever namespaceObject you want to add logging to, you just call:

functionLogger.addLoggingToNamespace(yourNamespaceObject);

Here's a fiddle to see it in action.

UPDATE
Note that you can call functionLogger.addLoggingToNamespace(window); to add logging to all global functions at the time of the call. Also, if you really want, you can traverse the tree to find any functions and update them accordingly. The one downfall of this method is that it only works on functions that exist at the time. Thus, it's still not the greatest solution, but it's a LOT less work than adding logging statements by hand :)

Briguy37
  • 8,342
  • 3
  • 33
  • 53
  • thanks interesting answer but I need it to be more generic than that, to handle non-namespace functions. And yes, I *DO* want to "intercept all function calls globally to insert logging". (well maybe not jQuery) There's gotta be a way... wish browsers supported this. it'd make a programmer's life so much easier – Shai UI Aug 07 '12 at 21:08
  • 2
    @foreyez: No problem, sorry I don't have a good solution for that. Agreed, I've thought this would be nice many times :) – Briguy37 Aug 07 '12 at 21:10
  • @foreyez: It doesn't work on a fiddle, but try `functionLogger.addLoggingToNamespace(window);` to add it to all global functions. Also, if you want, you can iterate down the object tree from there to add logging to everything. – Briguy37 Aug 07 '12 at 21:27
  • awesome stuff, but for some reason it makes some of my function calls not work, I still need to look into why it messes them up... but thanks for getting this on the right track – Shai UI Aug 09 '12 at 00:16
  • @foreyez: Welcome, and hope you figure it out. If you do or have a reproducible case, please let us know as it'd be nice to correct whatever the problem is here or debug it. I thought it might be a scope issue, but each test case I've tried has the correct scope, so not sure what's going on. – Briguy37 Aug 09 '12 at 13:29
  • found the bug, where it says "func.apply(this, arguments);" write instead "return func.apply(this, arguments);" or it won't return anything, and yes, better to do it on object namespaces – Shai UI Aug 10 '12 at 22:53
  • Hey guys, thanks for that solution. I've improved it a little though to fit my needs. ;) have a Look at [this sample code](http://jsfiddle.net/s7GAW/). I've added the microtime and an option to display when calls are finished (returned) – Senči Apr 12 '13 at 12:48
  • What is `this` in the context of the function? Does `this` become `functionLogger` or does it retain whatever object was `this` at the time of the call? – jimbobmcgee May 22 '17 at 11:35
  • @jimbobmcgee It should retain the normal context. – Briguy37 May 22 '17 at 13:27
  • I tried this solution and I think this might not be the optimal as the modified functions are stripped of any nested members (e.g. injected via `.extend()`). **This breaks the code.** In `getLoggableFunction` you should iterate through nested members and add them to the result before returning it. – ttaaoossuuuu May 25 '18 at 14:57
  • This would be brilliant, if it wouldn't fail with class constructors, `TypeError: Class constructors cannot be invoked without 'new'` – Nikita Fuchs Jul 13 '21 at 13:14
17

This is called profiling and Chrome and Firebug have it built in. In Chrome developer Tools, go to the profiles tab and click the record (circle) button. Perform your ajax and after your response, click the record button again to stop. The results of the profiling will appear in the right pane.

Note, this is going to give you everything so if you are using a library like jQuery, the vast majority of the function calls are going to be garbage to you. I've tried this a few times and I find it is much more helpful to do the console.log('inside <method>') thing.

Jeff
  • 13,943
  • 11
  • 55
  • 103
  • 3
    meh, I don't want a profiler. I just want somethnig to show the func calls in the console. Perhaps after I type in turnOnTrace() or something... Also, I don't want to keep track of jquery calls. So it should give me an option to exclude libraries. And lastly, the profiling tab didn't show me my internal functions(), like the ones I wrote, so it doesn't even work. Perhaps there's a way to automate the console.log in each function. – Shai UI Aug 07 '12 at 20:42
5

I just found out that you could do that with a console.trace()

killebytes
  • 940
  • 1
  • 10
  • 24
4

A variation on Briguy37's solution, I wrote one that accepts a function to call before each method. It also works with ECMAScript 6 classes, where methods are not enumerated by for...in. I'm using it to modify Object prototypes, to add logging to all new instances of my object.

function inject(obj, beforeFn) {
    for (let propName of Object.getOwnPropertyNames(obj)) {
        let prop = obj[propName];
        if (Object.prototype.toString.call(prop) === '[object Function]') {
            obj[propName] = (function(fnName) {
                return function() {
                    beforeFn.call(this, fnName, arguments);
                    return prop.apply(this, arguments);
                }
            })(propName);
        }
    }
}

function logFnCall(name, args) {
    let s = name + '(';
    for (let i = 0; i < args.length; i++) {
        if (i > 0)
            s += ', ';
        s += String(args[i]);
    }
    s += ')';
    console.log(s);
}

inject(Foo.prototype, logFnCall);
Peter Tseng
  • 13,613
  • 4
  • 67
  • 57
3

Maybe you can have JavaScript do some of the work of adding console.log for you:

Adding console.log to every function automatically

Also this blog by Paul Irish might help:

http://paulirish.com/2009/log-a-lightweight-wrapper-for-consolelog/

It includes a link to some JavaScript specifically targeted at logging arguments:

http://pastie.org/1033665

Community
  • 1
  • 1
Jason Sperske
  • 29,816
  • 8
  • 73
  • 124
3

Give a try to diyism_trace_for_javascript.htm:

https://code.google.com/p/diyism-trace/downloads/list

eval('window.c=function(){3+5;}');
declare_ticks_for(window);

function a(k, c) {
  return k + 2;
}

function b() {
  4 + 3;
  a(3, {'a':'c','b':'d'});
  c();
  return 5 + 4;
}

b();

View logs in console tab of chrome or firefox

hexacyanide
  • 88,222
  • 31
  • 159
  • 162
diyism
  • 12,477
  • 5
  • 46
  • 46
3

Let me throw a third solution into the ring: an omniscient debugger.

Note that all other answers offer two kinds of solutions:

  1. Manually patch your JS functions in run-time, and log them to console
    • Yes it can get the job done, but will be useless once your project grows to a certain size. It does not give you sufficient controlability, unless you keep spending time on keeping on deleloping this feature.
  2. Jeff proposes using a profiler for debugging purposes
    • Not very helpful, as the profiler views (at least for now) are designed to help you analyze performance, not the call graph; does not work well, unless you spend a lot of time training yourself to getting used to the counter-productive user interface.

That is why I wrote Dbux - a VSCode extension that provides an omniscient debugger with dynamic execution analysis tools, code annotations and a full-blown dynamic call graph visualization tool, aimed at helping developers with Program Comprehension and Debugging.

Some examples -

Call Graph of a fibonacci(6):

Call Graph with code and other Dbux Tools in one screen:

Links:

Domi
  • 22,151
  • 15
  • 92
  • 122
1

You can trace function calls with help of putout code transformer. Plugin will look this way:

const {template, types, operator} = require('putout');
const {replaceWith} = operator;
const {BlockStatement} = types;

// create nodes
const buildLog = template(`console.log('TYPE' + ' ' + 'NAME')`);
const buildLogEnter = template(`console.log('enter' + ' ' + 'NAME' + '(' + JSON.stringify(Array.from(arguments)) + ')')`);
const buildLogException = template(`console.log('TYPE' + ' ' + 'NAME' + ': ' + trace$error.message); throw trace$error`);
const buildTryCatch = template(`try {
        BLOCK;
    } catch(trace$error) {
        CATCH;
    } finally {
        FINALLY;
    }
`);

const JSON = 'JSON';

// nodes we are searching for
module.exports.include = () => [
    'Function',
];

module.exports.fix = (path) => {
    const name = getName(path);
    
    // create 3 types of events
    const enterLog = buildLogEnter({
        NAME: name,
        JSON,
    });
    const exitLog = buildLogEvent(name, 'exit');
    const errorLog = buildLogExceptionEvent(name);
    
    // move function body into try-catch
    const bodyPath = path.get('body');
    replaceWith(bodyPath, BlockStatement([buildTryCatch({
        BLOCK: path.node.body.body,
        CATCH: errorLog,
        FINALLY: exitLog,
    })]));
    
    // add into the beginning of function "console.log" with "enter" event
    bodyPath.node.body.unshift(enterLog);
};


// get name of a function
function getName(path) {
    if (path.isClassMethod())
        return path.node.key.name;
    
    if (path.isFunctionDeclaration())
        return path.node.id.name;
    
    const {line} = path.node.loc.start;
    return `<anonymous:${line}>`;
}

// build logger
function buildLogEvent(name, type) {    
    return buildLog({
        NAME: name,
        TYPE: type,
    });
}

// build logger that throws
function buildLogExceptionEvent(name) {    
    return buildLogException({
        NAME: name,
        TYPE: 'error',
    });
}

Let's suppose that this is the code you want to trace:

const processFile = (a) => a;
process([]);

function process(runners) {
    const files = getFiles(runners);
    const linted = lintFiles(files);
    
    return linted;
}

function getFiles(runners) {
    const files = [];
    
    for (const run of runners) {
        files.push(...run());
    }
    
    return files;
}

function lintFiles(files) {
    const linted = [];
    
    for (const file of files) {
        linted.push(processFile(file));
    }
   
    return linted;
}

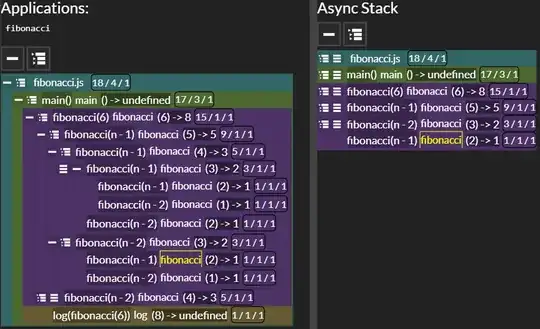
Here is a full picture:

enter image description here

If you save processed source as trace.js and run it with node, you will have:

> node trace.js
enter process([[]])
enter getFiles([[]])
exit getFiles
enter lintFiles([[]])
exit lintFiles
exit process

There is putout issue related to tracing functions.

coderaiser
  • 749
  • 5
  • 15
0

I've used @Briguy37's solution with an improvement. In my case, I did not want to trace functions from some libraries, so I added some code to exclude them. Here is how it is used:

  • First, include the definition of the functions you don't want to trace;
  • excludeLoggingToNamespace to list the functions defined up to now and exclude them;
  • Include the definition of the functions you want to trace;
  • Call addLoggingToNamespace to add the logging capability to the functions defined in the above step.

Example:

<script src="js/someLibrary.js"></script>
<script>
    functionLogger.excludeLoggingToNamespace(window);
</script>
<script src="js/codeIWantToTraceHere.js"></script>
<script>
    functionLogger.addLoggingToNamespace(window);
</script>

Here is the code I added to @Briguy37's solution:

var excludedFunctions = {};

        functionLogger.excludeLoggingToNamespace = function(namespaceObject){
            for(var name in namespaceObject){
                var potentialFunction = namespaceObject[name];

                if(Object.prototype.toString.call(potentialFunction) === '[object Function]') {
                    excludedFunctions[name] = name;
                }
            }
        }; 

And I had to modify @Briguy37's addLoggingToNamespace method to take into accound the excludedFunctions hash:

functionLogger.addLoggingToNamespace = function(namespaceObject){
    for(var name in namespaceObject){
        var potentialFunction = namespaceObject[name];

        if(Object.prototype.toString.call(potentialFunction) === '[object Function]' && 
           !excludedFunctions[name]) {
            namespaceObject[name] = functionLogger.getLoggableFunction(potentialFunction, name);
        }
    }
};    
Jean-François Beauchamp
  • 5,485
  • 8
  • 43
  • 77