2

I have stumbled across a problem in R that I was hoping someone could clear up why it is happening and how to fix it. I am not well vetted in the use of R and sometimes get muddled in the way that one line of code can often do much more than many other languages. The problem seems to be that the program isn't correctly taking the file inputs after the first. If I input one file, the histogram comes out the way I would expect. But unfortunately when more than one file is input it combines them and smooshes them next to the first. I would rather each input file have its own stand alone histogram. Sorry for the long post but I am trying to give as much info as I can to make my code reproducible (I am bad at reproducible code it seems).

The code is as such:

library("tcltk")
#choose any number of files
File.names<-(tk_choose.files(default="", caption="Choose your files", multi=TRUE, filters=NULL, index=1))
Num.Files<-NROW(File.names)
#read the tables
dat <- lapply(File.names,read.table,header = TRUE)
names(dat) <- paste("f", 1:length(Num.Files), sep="")
#use the 14th columns data
tmp <- stack(lapply(dat,function(x) x[,14]))
#this is where the histogram is made(with percent shown on the y axis)
require(ggplot2)
ggplot(tmp,aes(x = values)) + 
    facet_wrap(~ind) +
    geom_histogram(aes(y=..count../sum(..count..)))
dput(tmp)
dput(dat)
sessionInfo()

Here is an example of a file that could be chosen by the user:

Targ  cov  av_cov  87A_cvg  87Ag  87Agr  87Agr  87A_gra  87A%_1   87A%_3   87A%_5   87A%_10  87A%_20  87A%_30 87A%_40   87A%_50 87A%_75 87A%_100
1:028 400   0.42    400 0.42    1   1   2   41.8    0.0 0.0 0.0 0.0 0.0 0.0 0.0 0.0 0.0
1:296 400   0.42    400 0.42    1   1   2   41.8    0.0 0.0 0.0 0.0 0.0 0.0 0.0 0.0 0.0
1:453 1646  8.11    1646    8.11    7   8   13  100.0   100.0   87.2    32.0    0.0 0.0 0.0 0.0 0.0 0.0
1:427 1646  8.11    1646    8.11    7   8   13  100.0   100.0   87.2    32.0    0.0 0.0 0.0 0.0 0.0 0.0
1:736 5105  29.68   5105    29.68   14  29  48  100.0   100.0   100.0   86.0    65.7    49.4    35.5    16.9    0.0 0.0
1:514 5105  29.68   5105    29.68   14  29  48  100.0   100.0   100.0   86.0    65.7    49.4    35.5    16.9    0.0 0.0
1:296 5105  29.68   5105    29.68   14  29  48  100.0   100.0   100.0   86.0    65.7    49.4    35.5    16.9    0.0 0.0
1:534 400   0.42    400 0.42    1   1   2   41.8    0.0 0.0 0.0 0.0 0.0 0.0 0.0 0.0 0.0

And another:

Targ  cov  av_cov  87A_cvg  87Ag  87Agr  87Agr  87A_gra  87A%_1   87A%_3   87A%_5   87A%_10  87A%_20  87A%_30 87A%_40   87A%_50 87A%_75 87A%_100
    1:028 400   0.42    400 0.42    1   1   2   41.8    0.0 1.0 0.0 20.0    0.0 0.0 0.0 0.0 0.0
    1:296 400   0.42    400 0.42    1   1   2   41.8    0.0 20.0    0.0 40.0    0.0 100.0   10.0    50.0    4.0
    1:453 1646  8.11    1646    8.11    7   8   13  100.0   100.0   87.2    32.0    0.0 100.0   4.0 60.0    30.0    20.0
    1:427 1646  8.11    1646    8.11    7   8   13  100.0   100.0   87.2    32.0    0.0 80.0    40.0    60.0    80.0    90.0
    1:736 5105  29.68   5105    29.68   14  29  48  100.0   100.0   100.0   86.0    65.7    49.4    35.5    16.9    30.0    20.0
    1:514 5105  29.68   5105    29.68   14  29  48  100.0   100.0   100.0   86.0    65.7    49.4    35.5    16.9    20.0    30.0
    1:296 5105  29.68   5105    29.68   14  29  48  100.0   100.0   100.0   86.0    65.7    49.4    35.5    16.9    20.0    30.0
    1:534 400   0.42    400 0.42    1   1   2   41.8    0.0 40.0    30.0    80.0    70.0    40.0    30.0    30.0    10.0

The code works well with one file(these histograms are made from different input files but you get the picture) but disagrees with multiple files (regardless of the number): One: One

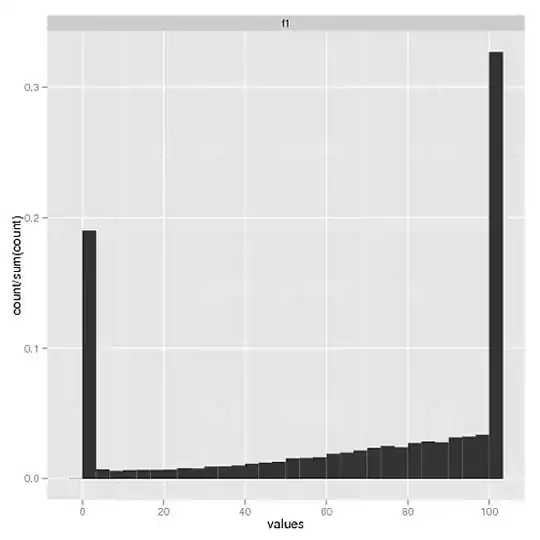
This is how I hope all of the histograms to look, one for each entered file. But alas...
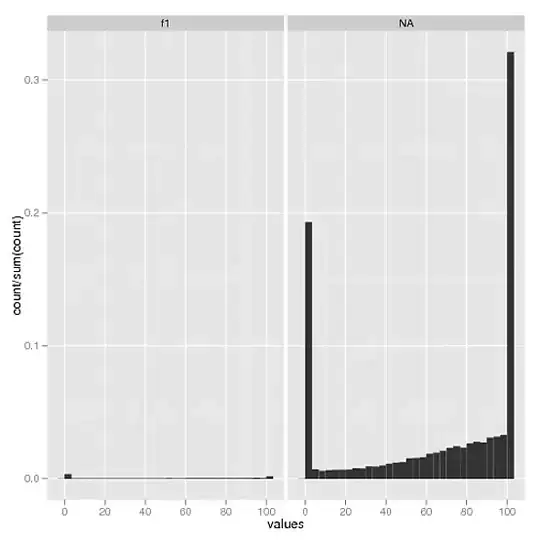
 Multiple files: Multiple

> dput(tmp)
structure(list(values = c(0, 0, 0, 0, 49.4, 49.4, 49.4, 0), ind = structure(c(1L, 
1L, 1L, 1L, 1L, 1L, 1L, 1L), .Label = "f1", class = "factor")), .Names = c("values", 
"ind"), row.names = c(NA, -8L), class = "data.frame")
> dput(dat)
structure(list(f1 = structure(list(Targ = structure(c(1L, 2L, 
4L, 3L, 7L, 5L, 2L, 6L), .Label = c("1:028", "1:296", "1:427", 
"1:453", "1:514", "1:534", "1:736"), class = "factor"), cov = c(400L, 
400L, 1646L, 1646L, 5105L, 5105L, 5105L, 400L), av_cov = c(0.42, 
0.42, 8.11, 8.11, 29.68, 29.68, 29.68, 0.42), "X87A_cvg", "X87Ag", "X87Agr", "X87Agr.1", "X87A_gra", "X87A._1", "X87A._3", "X87A._5", "X87A._10", "X87A._20", "X87A._30", "X87A._40", 
"X87A._50", "X87A._75", "X87A._100"), class = "data.frame", row.names = c(NA, 
-8L))), .Names = "f1")
> sessionInfo()
R version 2.14.1 (2011-12-22)
Platform: x86_64-redhat-linux-gnu (64-bit)
    locale:
 [1] LC_CTYPE=en_US.UTF-8       LC_NUMERIC=C              
 [3] LC_TIME=en_US.UTF-8        LC_COLLATE=en_US.UTF-8    
 [5] LC_MONETARY=en_US.UTF-8    LC_MESSAGES=en_US.UTF-8   
 [7] LC_PAPER=C                 LC_NAME=C                 
 [9] LC_ADDRESS=C               LC_TELEPHONE=C            
[11] LC_MEASUREMENT=en_US.UTF-8 LC_IDENTIFICATION=C       
    attached base packages:
[1] tcltk     stats     graphics  grDevices utils     datasets  methods  
[8] base     
    other attached packages:
[1] ggplot2_0.9.1
    loaded via a namespace (and not attached):
 [1] colorspace_1.1-1   dichromat_1.2-4    digest_0.5.2       grid_2.14.1       
 [5] labeling_0.1       MASS_7.3-17        memoise_0.1        munsell_0.3       
 [9] plyr_1.7.1         proto_0.3-9.2      RColorBrewer_1.0-5 reshape2_1.2.1    
[13] scales_0.2.1       stringr_0.6 

Is there any way to make each histogram separate, and able to stand alone? Thanks in advance Steph

Stephopolis
  • 1,765
  • 9
  • 36
  • 65
  • 1
    Do you just want different scales on the y axis for the histograms? Is that what you want? I mean, you **are** plotting all the files in one plot because **you** stacked all the data and **you** passed it all to ggplot to plot **all** the data. If you do want separate scales, that can be done, but if you want separate plot, why are you potting them as if one faceted data set? You don't need facetting to get multiple grid-based plots on a single device. – Gavin Simpson Aug 10 '12 at 16:11
  • @GavinSimpson Eh, the reason it is a faceted data set, to be quite honest, is because I am new to R. Originally I had used the lattice package and histogram from that to make separate histograms but as I was trying to learn how to take multiple file inputs from users it was suggested I change to this, which I know considerably less well. Hence why I am here. Sorry if the question seems ponderous to you. I was just hoping for some guidance. Thanks for taking a look though. – Stephopolis Aug 10 '12 at 17:32
  • Your `dput(dat)` is outputting something that results in a corrupted data frame on my Linux box. Are you sure that is reproducible? Given your comment reply I, in all seriousness, would suggest you learn to walk before trying to run. You are dabbling with some reasonably advanced concepts here. Start simple, don't stack the data and use base graphics to do the plot. You'll have much less trouble that way. once you understand what is going on and learn a bit of ggplot then you will feel more comfortable using these more advanced constructs and higher level plotting packages. – Gavin Simpson Aug 10 '12 at 18:32
  • @GavinSimpson Sadly, I thought it would come to that. I have vainly been struggling against it, as it would undo a day of work. Thanks though, for your help. – Stephopolis Aug 10 '12 at 18:35
  • 1
    See if my new Answer helps any then. – Gavin Simpson Aug 10 '12 at 18:43

2 Answers2

4

Given your dat is returning a corrupted data frame for dat on my system, here is a simpler approach using base R with dummy data.

## fake a list of data frames, here, 4, each with two columns
dat <- list(file1 = data.frame(X = runif(20), Y = rnorm(20)),
            file2 = data.frame(X = runif(20), Y = runif(20)),
            file3 = data.frame(X = runif(20),
                               Y = rnorm(20) + rnorm(20, mean = 2, sd = 2)),
            file4 = data.frame(X = runif(20), Y = rnorm(20, mean = 4)))

## extract the second column from each
## (this is the same as your code extracting the 14 column)
tmp <- lapply(dat, `[[`, 2)

Now look at what we have:

R> str(tmp)
List of 4
 $ file1: num [1:20] -1.0225 -0.0302 -0.0987 1.977 0.2579 ...
 $ file2: num [1:20] 0.84583 0.49525 0.12287 0.43929 0.00132 ...
 $ file3: num [1:20] 2.03 5.27 1.57 2.72 1.12 ...
 $ file4: num [1:20] 4.54 4.08 4.28 4.48 6.36 ...

So try to plot the first component of tmp:

hist(tmp[[1]])

OK, so that works. Now we know we can plot all the components. Here are a couple of ways to do it:

layout(matrix(1:4, ncol = 2))
for(p in seq_along(tmp)) {
    hist(tmp[[p]])
}
layout(1)

Or using lapply() to do the loop for us

layout(matrix(1:4, ncol = 2))
lapply(tmp, function(x) {hist(x); invisible()})
layout(1)

Both generate something like this:

matrix of historgrams

Obviously we could tailor the plot axis labels and titles better, but I leave that as an exercise for the reader.

Gavin Simpson
  • 170,508
  • 25
  • 396
  • 453
  • This is fantastic. Especially since it is easy to understand. I very much appreciate it. And I will do as you suggest and try to walk before I run. Thanks again! – Stephopolis Aug 10 '12 at 18:48
0

It's because you are using facet_wrap(). If you wish to have one plot per input then you must make a loop

library("tcltk")
#choose any number of files
File.names<-(tk_choose.files(default="", caption="Choose your files", multi=TRUE, filters=NULL, index=1))
Num.Files<-NROW(File.names)
#read the tables
dat <- lapply(File.names,read.table,header = TRUE)
names(dat) <- paste("f", 1:length(Num.Files), sep="")
#use the 14th columns data
tmp <- stack(lapply(dat,function(x) x[,14]))
#this is where the histogram is made(with percent shown on the y axis)
gHist <- function(df){
   require(ggplot2)
   # New page so it doesn't overplot previous graphs
   grid.newpage()
   ggplot(df,aes(x = values)) + 
      geom_histogram(aes(y=..count../sum(..count..)))+
      # Add a tible
      opts(title = unique(df$ind))
}
# Split gives a list of the data.frame splited by ind
# Then lapply will cycle through the list and
# apply the function to each piece
lapply(split(tmp, tmp$ind), gHist)

You only provided data for only one plot so I only made one. And R complains about dput(dat) is corrupted.

enter image description here

Luciano Selzer
  • 9,806
  • 3
  • 42
  • 40
  • I added another file to use, in case it helps (as I mentioned I am just awful at making sure my code is reproducible). When implementing the code you provided only one histogram is produced. Do you mind explaining the opts and lapply lines for me? – Stephopolis Aug 10 '12 at 17:08
  • 2
    @Stephopolis If you want to make sure your code is reproducible open a new R session and run the code you just posted. That way you will know. – Luciano Selzer Aug 10 '12 at 17:33
  • @Iselzer Ah. Of course. For some reason the most logical of solutions is never the first that I think of. But experience is changing that. Thank you very much – Stephopolis Aug 10 '12 at 17:40
  • Hm, that didn't seem to help. It is just making empty blank pages and then the same one histogram. Could this be caused by the fact that I am running R from a Unix machine via command line? – Stephopolis Aug 10 '12 at 18:00
  • 1
    @Stephopolis Regarding reproducible examples:: http://stackoverflow.com/questions/5963269/how-to-make-a-great-r-reproducible-example?lq=1 . Github's https://gist.github.com/ may be of immediate benefit. – Thell Aug 10 '12 at 18:59