3

Possible Duplicate:
Simplest way to profile a PHP script

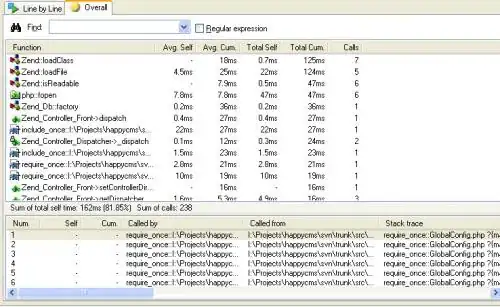
Sometimes my website loads slowly and I would like to trace which function causes it. (or if it is related to me or the webserver) How can I get execution times of each function that is being run?

Like;

<?php
function A() { }
function B() { }
function C() { }
A();
B();

Trace();
?>

Trace() would output: A ran in 0,1 miliseconds, B ran in 1,1 seconds, script completed. Is there any debugging feature like this in PHP?

Ps. I'm not speaking about applying microtime for each function.

Community
  • 1
  • 1
Aristona
  • 8,611
  • 9
  • 54
  • 80
  • you can use a profiling tool like the one xdebug offers [xdebug profiler documentation](http://xdebug.org/docs/profiler) – r3bel Aug 13 '12 at 23:59
  • You can try https://github.com/facebook/xhprof/ as well. – Shi Aug 14 '12 at 00:02

3 Answers3

9

Use:

  • XHProf if you need to profile in production environments. It has a footprint, but it's usually affordable. It does not produce trace if the script ends unexpectedly though.

http://blog.tech4him.com/wp-content/uploads/xhprof1.png http://www.wiktik.com/blog/wp-content/uploads/2012/02/xhprof-callgraph_small.png

  • XDebug if you want to profile in development and testing environments. It's generally more reliable, but has a noticeable footprint; long running scripts will generate very large (100s MBs) files for instance, as opposed to XHProf.

http://blog.haohtml.com/wp-content/uploads/2010/03/win_xdebug_WinCacheGrind_4.jpg

Don't use:

  • APD, because even though it's recommended in this answer, it's very outdated and doesn't look like it's being developed anymore (last release in 2004 according to its PECL page)

PS: My personal recommendation: Play with them all if you have the time to do so, or just set up xdebug in your dev environment otherwise.

Community
  • 1
  • 1
Mahn
  • 16,261
  • 16
  • 62
  • 78
  • Thanks for the reply, I'm going to select it as the answer soon, but my question was about the production environment. It's typical linux hosting server that I have no access. Their MySQL server may have problems which causes the slow load, but in my development environment, I'm using my own MySQL server, so in the end I wouldn't be able to find the source of problems. There is no other basic alternatives to the ones you mentioned above? – Aristona Aug 14 '12 at 00:32
  • Hm not really, this kind of debugging can only be performed installing extensions to PHP; if you have no root access to the server the only thing you can do is relying on microtime benchmarks :/ – Mahn Aug 14 '12 at 00:36
  • Okay mate, guess I'll order a VPS or similar - would need it for my node server anyway. :p Thanks alot once again. – Aristona Aug 14 '12 at 00:39
  • A more up to date link for XHProf is: https://pecl.php.net/package/xhprof – cgaldiolo May 11 '21 at 16:56
0

Take a look at http://xdebug.org/docs/profiler

Terence Johnson
  • 1,637
  • 1
  • 16
  • 21
0

I wouldn't do this on your production site, but if you can replicate the problem in a test setting, use profiling to determine where you are spending all your execution time. You'll need to install XDebug or equivalent. http://xdebug.org/docs/profiler

Trott
  • 66,479
  • 23
  • 173
  • 212