2

I have 3 shp files for create a city map:

  • land.shp (polygon drawing the land which is above water)
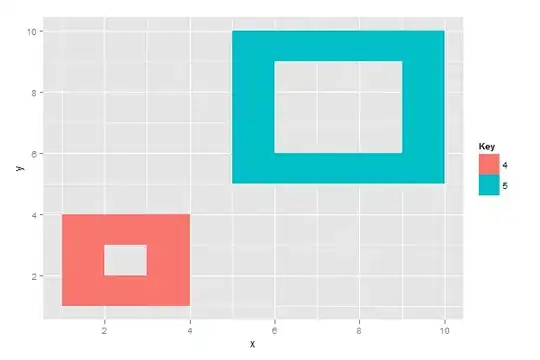
  • road.shp (polygon drawing all the roads, note that some of them are "circular road", which means a hole is in the middle)
  • building.shp (polygon drawing all buildings)

I used QGIS to plot the map I want, then I use ggplot to play the land.shp, then road.shp and building shp to do it again. The one below is output from Google map to illustrate my issue:

enter image description here

You can see there are 2 bridges and some sea (I don't have sea shp, I just set the background to be blue) between them, tagged using blue dot. In R, that area should be a hole, but it is all filled with grey. The same issue go to the grey area tagged using red dot, which is a piece of land, and another grey area tagged using green dot, which is a building surrounded by road.

I will have land/sea/building in the hole of road.shp, I can't show them using R.

Can anyone teach me how to show the things behind the road.shp layer in R? Thanks.

Julius Vainora
  • 47,421
  • 9
  • 90
  • 102
lokheart
  • 23,743
  • 39
  • 98
  • 169
  • 2
    Why do you have a polygon to draw roads? Roads are linear features, so it should be lines. Line data sets don't have holes. *confused* – Spacedman Aug 20 '12 at 07:57
  • 1
    So, the map you've included doesn't actually show what happens in R? Wouldn't the R output be more useful? *even more confused* – Spacedman Aug 20 '12 at 07:59
  • 2
    If there really is an area for the "sea" that you read into R and it shows up grey, then either the plotting is not respecting the "holeness" or the sea is really an actual area that you could plot blue (or transparent). We really need the data itself, or failing that the code you are using and the result you see. – mdsumner Aug 20 '12 at 08:00

1 Answers1

11

One common convention to draw polygons with holes is:

  • A closed polygon with points that progress anti-clockwise forms a solid shape
  • A closed polygon with points progressing clockwise forms a hole

So, let's construct some data and plot:

library(ggplot2)

ids <- letters[1:2]

# IDs and values to use for fill colour
values <- data.frame(
  id = ids,
  value = c(4,5)
)

# Polygon position
positions <- data.frame(
  id = rep(ids, each = 10),
  #     shape      hole         shape        hole
  x = c(1,4,4,1,1, 2,2,3,3,2,   5,10,10,5,5, 6,6,9,9,6),
  y = c(1,1,4,4,1, 2,3,3,2,2,   5,5,10,10,5, 6,9,9,6,6)
)

# Merge positions and values
datapoly <- merge(values, positions, by=c("id"))

ggplot(datapoly, aes(x=x, y=y)) + 
  geom_polygon(aes(group=id, fill=factor(value))) +
  scale_fill_discrete("Key")

enter image description here

Andrie
  • 176,377
  • 47
  • 447
  • 496
  • 1
    And if you also want the outline, assign a variable for each ring and use geom_path: datapoly$rings = c(rep(1,5),rep(2,5),rep(3,5),rep(4,5)) and add +geom_path(aes(group=rings)) to your ggplot – Spacedman Aug 21 '12 at 07:28
  • The following might be also relevant https://github.com/hadley/ggplot2/issues/752 – mlt Apr 17 '14 at 19:15