In VB.Net, put your data into a DataTable and bind it to a Chart control
Tutorials on how to bind a DataTable to a Chart are here and here.
Also, there a some open-source chart controls like this and this.
Edit:
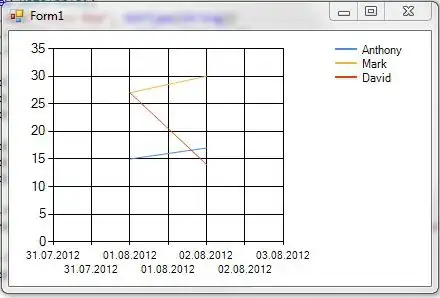
Here's a simple example to show you how the Chart works:
Private Sub Form1_Load(sender As System.Object, e As System.EventArgs) Handles MyBase.Load
    Dim table = New DataTable()
    table.Columns.Add("Sales Rep", GetType(String))
    table.Columns.Add("# of Sales", GetType(Integer))
    table.Columns.Add("Date", GetType(Date))

    table.Rows.Add("Anthony", 15, "2012 August 1")
    table.Rows.Add("Mark", 27, "2012 August 1")
    table.Rows.Add("David", 27, "2012 August 1")

    table.Rows.Add("Anthony", 17, "2012 August 2")
    table.Rows.Add("Mark", 30, "2012  August 2")
    table.Rows.Add("David", 14, "2012 August 2")

    Chart1.Series.RemoveAt(0)
    Chart1.DataBindCrossTable(table.DefaultView, "Sales Rep", "Date", "# of Sales", "")

    For Each s In Chart1.Series
        s.ChartType = SeriesChartType.Line
    Next
End Sub
Using Java, have a look into JFreeChart, which can also render different kinds of charts (and there a probably a lot of other Java controls/libs for displaying charts).