Is there any open source C# code or library to present a graphical waveform given a byte array?
Asked
Active
Viewed 2.6k times
5 Answers
45
This is as open source as it gets:
public static void DrawNormalizedAudio(ref float[] data, PictureBox pb,
    Color color)
{
    Bitmap bmp;
    if (pb.Image == null)
    {
        bmp = new Bitmap(pb.Width, pb.Height);
    }
    else
    {
        bmp = (Bitmap)pb.Image;
    }

    int BORDER_WIDTH = 5;
    int width = bmp.Width - (2 * BORDER_WIDTH);
    int height = bmp.Height - (2 * BORDER_WIDTH);

    using (Graphics g = Graphics.FromImage(bmp))
    {
        g.Clear(Color.Black);
        Pen pen = new Pen(color);
        int size = data.Length;
        for (int iPixel = 0; iPixel < width; iPixel++)
        {
            // determine start and end points within WAV
            int start = (int)((float)iPixel * ((float)size / (float)width));
            int end = (int)((float)(iPixel + 1) * ((float)size / (float)width));
            float min = float.MaxValue;
            float max = float.MinValue;
            for (int i = start; i < end; i++)
            {
                float val = data[i];
                min = val < min ? val : min;
                max = val > max ? val : max;
            }
            int yMax = BORDER_WIDTH + height - (int)((max + 1) * .5 * height);
            int yMin = BORDER_WIDTH + height - (int)((min + 1) * .5 * height);
            g.DrawLine(pen, iPixel + BORDER_WIDTH, yMax,
                iPixel + BORDER_WIDTH, yMin);
        }
    }
    pb.Image = bmp;
}
This function will produce something like this:
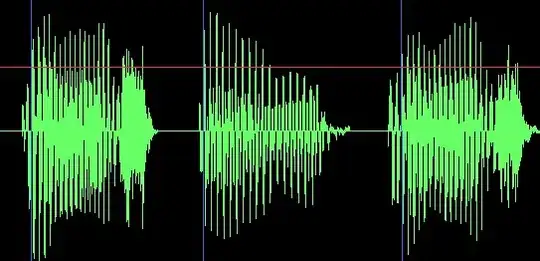
This takes an array of samples in floating-point format (where all sample values range from -1 to +1). If your original data is actually in the form of a byte[] array, you'll have to do a little bit of work to convert it to float[]. Let me know if you need that, too.
Update: since the question technically asked for something to render a byte array, here are a couple of helper methods:
public float[] FloatArrayFromStream(System.IO.MemoryStream stream)
{
    return FloatArrayFromByteArray(stream.GetBuffer());
}

public float[] FloatArrayFromByteArray(byte[] input)
{
    float[] output = new float[input.Length / 4];
    for (int i = 0; i < output.Length; i++)
    {
        output[i] = BitConverter.ToSingle(input, i * 4);
    }
    return output;
}
Update 2: I forgot there's a better way to do this:
public float[] FloatArrayFromByteArray(byte[] input)
{
    float[] output = new float[input.Length / 4];
    Buffer.BlockCopy(input, 0, output, 0, input.Length);
    return output;
}
I'm just so in love with for loops, I guess.
MusiGenesis
- 74,184
- 40
- 190
- 334
-
2Until you license it, and charge the OP $20 per use :) – Martin Oct 01 '09 at 18:56
-
5@Martin: I charge that just for *looking* at it. Where's my $20? :) – MusiGenesis Oct 02 '09 at 00:58
-
Cool algorithm. I was just calculating the closest sample to my pixel and putting a point there, but doing the max and min of the range of that pixel looks much better! – andrewrk May 06 '10 at 06:15
-
+1 for you! Thanks for the code! It helped a lot. However, I noticed that the helper methods aren't static, but the drawing method is. Just thought I'd point that out (call it OCD, I guess.) – Michael Hoffmann Apr 19 '11 at 15:13
-
This is fantastic! Simple algorithm with no external libraries needed, thanks. How would you draw a spectrogram in like manner? – John May 07 '12 at 18:42
-
@John: that depends on how you want to do it. Simplest way is to just draw a straight line between each adjacent pair of frequency bucket values; this will produce a single wavy line that shows the frequency distribution. You could also make a Bezier curve out of the points, although if you have enough data points this won't add much. – MusiGenesis May 08 '12 at 13:13
-
my sample values ranges are not falling between -1 to +1, and sometimes when it is calculating yMin, it is going to Infinity, dut to this i am getting overflow error, how to solve this? – manny Jul 09 '12 at 08:43
-
3@manny: you need to first normalize your data so that the values do fall between -1 and +1. One way to do this is to iterate through all your sample values and identify the largest absolute sample value, and then iterate through your samples again and divide each sample by this largest value; this will leave all samples between -1 and +1. Or, if your original audio is the redbook format (like on a CD), you can just divide by the largest possible absolute sample value (32768); this will probably not work as well as the first method. – MusiGenesis Jul 27 '12 at 13:24
-
@MusiGenesis I am very new to this, I want how to call the FloatArrayFromStream(System.IO.MemoryStream stream) function? – Illaya Dec 11 '13 at 07:30
-
Anybody say How to call the FloatArrayFromStream(System.IO.MemoryStream stream) function? – Illaya Dec 11 '13 at 07:32
10
I modified MusiGenesis's solution a little bit. This gave me a much better result, especially with house music :)
public static Bitmap DrawNormalizedAudio(List<float> data, Color foreColor, Color backColor, Size imageSize)
{
    Bitmap bmp = new Bitmap(imageSize.Width, imageSize.Height);

    int BORDER_WIDTH = 0;
    float width = bmp.Width - (2 * BORDER_WIDTH);
    float height = bmp.Height - (2 * BORDER_WIDTH);

    using (Graphics g = Graphics.FromImage(bmp))
    {
        g.Clear(backColor);
        Pen pen = new Pen(foreColor);
        float size = data.Count;
        for (float iPixel = 0; iPixel < width; iPixel += 1)
        {
            // determine start and end points within WAV
            int start = (int)(iPixel * (size / width));
            int end = (int)((iPixel + 1) * (size / width));
            if (end > data.Count)
                end = data.Count;

            float posAvg, negAvg;
            averages(data, start, end, out posAvg, out negAvg);

            float yMax = BORDER_WIDTH + height - ((posAvg + 1) * .5f * height);
            float yMin = BORDER_WIDTH + height - ((negAvg + 1) * .5f * height);

            g.DrawLine(pen, iPixel + BORDER_WIDTH, yMax, iPixel + BORDER_WIDTH, yMin);
        }
    }

    return bmp;
}


private static void averages(List<float> data, int startIndex, int endIndex, out float posAvg, out float negAvg)
{
    posAvg = 0.0f;
    negAvg = 0.0f;

    int posCount = 0, negCount = 0;

    for (int i = startIndex; i < endIndex; i++)
    {
        if (data[i] > 0)
        {
            posCount++;
            posAvg += data[i];
        }
        else
        {
            negCount++;
            negAvg += data[i];
        }
    }

    posAvg /= posCount;
    negAvg /= negCount;
}
robyy
- 101
- 1
- 2
-
1+1 I completely agree! thx for the addition. This method gives waveforms in the style of SoundCloud.com. – Sjors Miltenburg Jun 06 '12 at 09:15
-
@robyy How to call Bitmap DrawNormalizedAudio(List
data, Color foreColor, Color backColor, Size imageSize) function? – Illaya Dec 11 '13 at 07:30 -
Anybody say How to call Bitmap DrawNormalizedAudio(List
data, Color foreColor, Color backColor, Size imageSize) function? – Illaya Dec 11 '13 at 07:31
6
with adapted code from robby and using Graphics.Fill/DrawClosedCurve with antialiasing, I get a pretty good looking result.
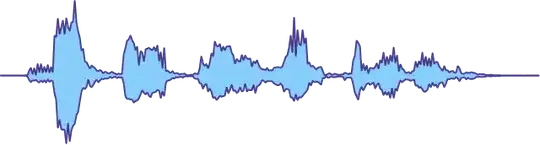
here's the code:
using System;
using System.Drawing;
using System.Drawing.Drawing2D;

namespace Soundfingerprinting.Audio.Services
{
    public static class AudioVisualizationService
    {
        public class WaveVisualizationConfiguration
        {
            public Nullable<Color> AreaColor { get; set; }
            public Nullable<Color> EdgeColor { get; set; }
            public int EdgeSize { get; set; }
            public Nullable<Rectangle> Bounds { get; set; }
            public double Overlap { get; set; }
            public int Step { get; set; }
        }

        public static void DrawWave(float[] data, Bitmap bitmap, WaveVisualizationConfiguration config = null)
        {
            Color areaColor = Color.FromArgb(0x7F87CEFA);// Color.LightSkyBlue; semi transparent
            Color edgeColor = Color.DarkSlateBlue;
            int edgeSize = 2;
            int step = 2;
            double overlap = 0.10f; // would better use a windowing function
            Rectangle bounds = Rectangle.FromLTRB(0, 0, bitmap.Width, bitmap.Height);

            if (config != null)
            {
                edgeSize = config.EdgeSize;
                if (config.AreaColor.HasValue)
                    areaColor = config.AreaColor.GetValueOrDefault();
                if (config.EdgeColor.HasValue)
                    edgeColor = config.EdgeColor.GetValueOrDefault();
                if (config.Bounds.HasValue)
                    bounds = config.Bounds.GetValueOrDefault();

                step = Math.Max(1, config.Step);
                overlap = config.Overlap;
            }

            float width = bounds.Width;
            float height = bounds.Height;

            using (Graphics g = Graphics.FromImage(bitmap))
            {
                Pen edgePen = new Pen(edgeColor);
                edgePen.LineJoin = LineJoin.Round;
                edgePen.Width = edgeSize;
                Brush areaBrush = new SolidBrush(areaColor);

                float size = data.Length;
                PointF[] topCurve = new PointF[(int)width / step];
                PointF[] bottomCurve = new PointF[(int)width / step];
                int idx = 0;
                for (float iPixel = 0; iPixel < width; iPixel += step)
                {
                    // determine start and end points within WAV
                    int start = (int)(iPixel * (size / width));
                    int end = (int)((iPixel + step) * (size / width));
                    int window = end - start;
                    start -= (int)(overlap * window);
                    end += (int)(overlap * window);
                    if (start < 0)
                        start = 0;
                    if (end > data.Length)
                        end = data.Length;

                    float posAvg, negAvg;
                    averages(data, start, end, out posAvg, out negAvg);

                    float yMax = height - ((posAvg + 1) * .5f * height);
                    float yMin = height - ((negAvg + 1) * .5f * height);
                    float xPos = iPixel + bounds.Left;
                    if (idx >= topCurve.Length)
                        idx = topCurve.Length - 1;
                    topCurve[idx] = new PointF(xPos, yMax);
                    bottomCurve[bottomCurve.Length - idx - 1] = new PointF(xPos, yMin);
                    idx++;
                }

                PointF[] curve = new PointF[topCurve.Length * 2];
                Array.Copy(topCurve, curve, topCurve.Length);
                Array.Copy(bottomCurve, 0, curve, topCurve.Length, bottomCurve.Length);
                g.InterpolationMode = InterpolationMode.HighQualityBicubic;
                g.SmoothingMode = SmoothingMode.AntiAlias;
                g.FillClosedCurve(areaBrush, curve, FillMode.Winding, 0.15f);
                if (edgeSize > 0)
                    g.DrawClosedCurve(edgePen, curve, 0.15f, FillMode.Winding);
            }

        }

        private static void averages(float[] data, int startIndex, int endIndex, out float posAvg, out float negAvg)
        {
            posAvg = 0.0f;
            negAvg = 0.0f;

            int posCount = 0, negCount = 0;

            for (int i = startIndex; i < endIndex; i++)
            {
                if (data[i] > 0)
                {
                    posCount++;
                    posAvg += data[i];
                }
                else
                {
                    negCount++;
                    negAvg += data[i];
                }
            }

            if (posCount > 0)
                posAvg /= posCount;
            if (negCount > 0)
                negAvg /= negCount;
        }
    }
}
Lee_Nover
- 334
- 3
- 8
3
I've been a fan of ZedGraph for many years and have used it to display all kinds of data in various projects.
The following sample code graphs an array of doubles varying between -1 and 1:
void DisplayWaveGraph(ZedGraphControl graphControl, double[] waveData)
{
    var pane = graphControl.GraphPane;
    pane.Chart.Border.IsVisible = false;
    pane.Chart.Fill.IsVisible = false;
    pane.Fill.Color = Color.Black;
    pane.Margin.All = 0;
    pane.Title.IsVisible = false;
    pane.XAxis.IsVisible = false;
    pane.XAxis.Scale.Max = waveData.Length - 1;
    pane.XAxis.Scale.Min = 0;
    pane.YAxis.IsVisible = false;
    pane.YAxis.Scale.Max = 1;
    pane.YAxis.Scale.Min = -1;
    var timeData = Enumerable.Range(0, waveData.Length)
                             .Select(i => (double) i)
                             .ToArray();
    pane.AddCurve(null, timeData, waveData, Color.Lime, SymbolType.None);
    graphControl.AxisChange();
}
The above sample mimics the style of an audio editor by suppressing the axes and changing the colors to produce the following:

Nathan Baulch
- 20,233
- 5
- 52
- 56
3
In NAudio, there is code to draw audio waveforms in both WinForms and WPF. Have a look at the demo projects for examples of how to use it.
Mark Heath
- 48,273
- 29
- 137
- 194