I am new to ggplot2 and cannot figure out how to draw vertical dotted grey lines between
the points/dots along the x-axis. Here's my example code:
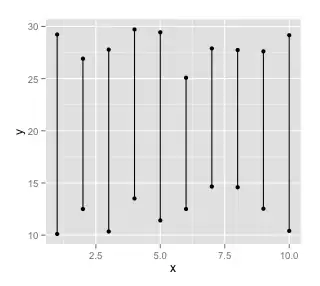
d1 <- runif(10,10,15)

d2 <- runif(10,25,30)

d3 <- rep(1:10,2)

df <- data.frame(x = d3, y = c(d1,d2))

ggplot(df, aes(x=x, y=y)) +

geom_point()