3

I currently have a method which queries a database for values, and plots them to a graph. The only problem is, the time variable is a long, and results in my graph looking like this:

graph

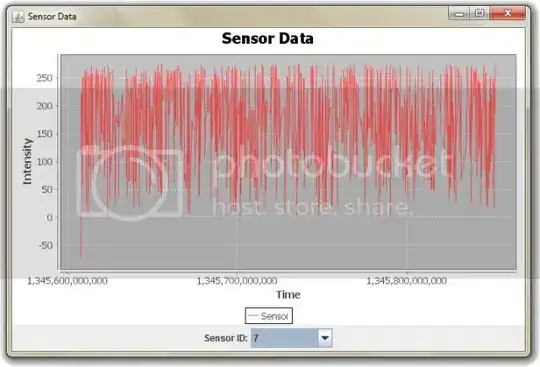
I want to convert it to a date format and then add it to the graph.

How can I do this?

Here is my graph code:

private Long time;
private Long intensity;
public XYSeries series = new XYSeries("Sensor");
private XYDataset xyDataset;
public JFreeChart chart;

xyDataset = new XYSeriesCollection(series);
chart = ChartFactory.createXYLineChart("Sensor Data", "Time", "Intensity", xyDataset, PlotOrientation.VERTICAL, true, true, false);

Here is my method for adding to the graph:

public void GetDustLevels() {
    series.clear();
    try {
        currentSensor = Application.getInstance().getMinesite().getSensors().get(sensorID);
    } catch (Exception e1) {
        e1.printStackTrace();
    }

    if (currentSensor != null) {
        sensorKDTree = currentSensor.getSensorData();
        Iterator<Map.Entry<GenericPoint<Long>, String>> allPoints = sensorKDTree.iterator(sensorKDTree.getMin(null), sensorKDTree.getMax(null));

        while (allPoints.hasNext()) {
            GenericPoint<Long> timeIntensityPair = allPoints.next().getKey();
            time = timeIntensityPair.getCoord(0);
            intensity = timeIntensityPair.getCoord(1);
            System.out.println("CURRENT SENSOR" + currentSensor);
            System.out.println("TIME: " + time + " " + "INTENSITY: " + intensity);
            series.add(time, intensity);
        }

    }


}

Any help would be GREATLY appreciated! Thank you!

EDIT: I have changed my code to this:

public TimeSeries series = new TimeSeries("Sensor", Date.class);
public JFreeChart chart;
private Long time;
private Long intensity;

TimeSeriesCollection xyDataset = new TimeSeriesCollection(series);
chart = ChartFactory.createTimeSeriesChart("Sensor Data", "Time", "Intensity", xyDataset, true, true, false);

And my new GetDustLevels() method:

 public void GetDustLevels() {
    series.clear();
    try {
        currentSensor = Application.getInstance().getMinesite().getSensors().get(sensorID);
    } catch (Exception e1) {
        e1.printStackTrace();
    }

    if (currentSensor != null) {
        sensorKDTree = currentSensor.getSensorData();
        Iterator<Map.Entry<GenericPoint<Long>, String>> allPoints = sensorKDTree.iterator(sensorKDTree.getMin(null), sensorKDTree.getMax(null));

        while (allPoints.hasNext()) {
            GenericPoint<Long> timeIntensityPair = allPoints.next().getKey();
            time = timeIntensityPair.getCoord(0);
            intensity = timeIntensityPair.getCoord(1);
            System.out.println("CURRENT SENSOR" + currentSensor);
            System.out.println("TIME: " + time + " " + "INTENSITY: " + intensity);
            XYPlot plot = (XYPlot) chart.getPlot();
            DateAxis axis = (DateAxis) plot.getDomainAxis();
            axis.setDateFormatOverride(new SimpleDateFormat("dd-MMM-yyyy"));
            series.add(new Date(time.longValue()), intensity);
        }

    }


}
Community
  • 1
  • 1
DommyCastles
  • 435
  • 3
  • 8
  • 21
  • Possible duplicate of [Display days in TimeSeriesChart](http://stackoverflow.com/questions/5583757/display-days-in-timeserieschart) – trashgod Sep 04 '12 at 23:57
  • I did research into these topics previously, but as you can see I have set mine up differently, and can't seem to figure it out. – DommyCastles Sep 05 '12 at 00:20
  • I don't see where you set the format. Please edit your question to include an [sscce](http://sscce.org/) that shows your current approach. – trashgod Sep 05 '12 at 00:30
  • I have edited it to suit, please help! Thank you :) Unfortunately, it will not be compilable for you, as it uses database queries not accessible to you. – DommyCastles Sep 05 '12 at 00:35
  • I think you shouldn't put following code in loop XYPlot plot = (XYPlot) chart.getPlot(); DateAxis axis = (DateAxis) plot.getDomainAxis(); axis.setDateFormatOverride(new SimpleDateFormat("dd-MMM-yyyy")); – shivshankar Sep 05 '12 at 10:17
  • Cross-posted [here](http://www.jfree.org/forum/viewtopic.php?f=3&t=115698). – trashgod Sep 06 '12 at 00:14

1 Answers1

6

Without an sscce or the desired format, I'm just guessing at a suitable DateFormat.

XYPlot plot = (XYPlot) chart.getPlot();
DateAxis axis = (DateAxis) plot.getDomainAxis();
axis.setDateFormatOverride(DateFormat.getDateInstance());

Addendum: Looking closer at your update, you're using ChartFactory.createXYLineChart(), which creates a NumberAxis for the domain. Instead, use ChartFactory.createTimeSeriesChart(), which creates a DateAxis for the domain.

Addendum: If time represents milliseconds from the same epoch as a Java Date, you can use new Date(time.longValue()) to construct your dataset's RegularTimePeriod. There's a related example here.

trashgod
  • 203,806
  • 29
  • 246
  • 1,045
  • This throws an error: `org.jfree.chart.axis.NumberAxis cannot be cast to org.jfree.chart.axis.DateAxis` Does `series` have to be of different type? – DommyCastles Sep 05 '12 at 00:44
  • I have tried your suggestion but I get the error `Cannot resolve method 'add Date, Long'` on the line `series.add(new Date(time.longValue()), intensity);` I have updated my question to the new way I've tried! – DommyCastles Sep 05 '12 at 01:30
  • Right, `Date` is not a `RegularTimePeriod`; you must choose one, e.g. `new Day(new Date(time.longValue()))`. No more guessing; post a _complete_ example. – trashgod Sep 05 '12 at 10:53
  • why is there three `M`s – O-9 Mar 11 '22 at 13:05
  • It's an arbitrary [`SimpleDateFormat`](https://docs.oracle.com/en/java/javase/17/docs/api/java.base/java/text/SimpleDateFormat.html); more above. – trashgod Mar 11 '22 at 16:57