1

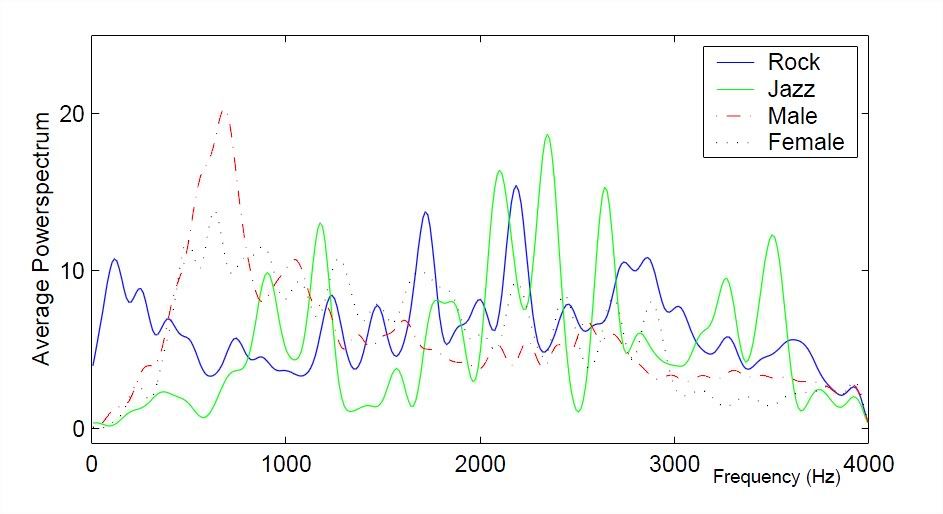
I have four 1xN sound signals and I want to view the average spectra plot like the one given in the link below: http://i1233.photobucket.com/albums/ff396/sakurayen/Plot/AMaximumLikelihoodApproachtoSinglechannelSourceseparationpdf-AdobeReader.jpg

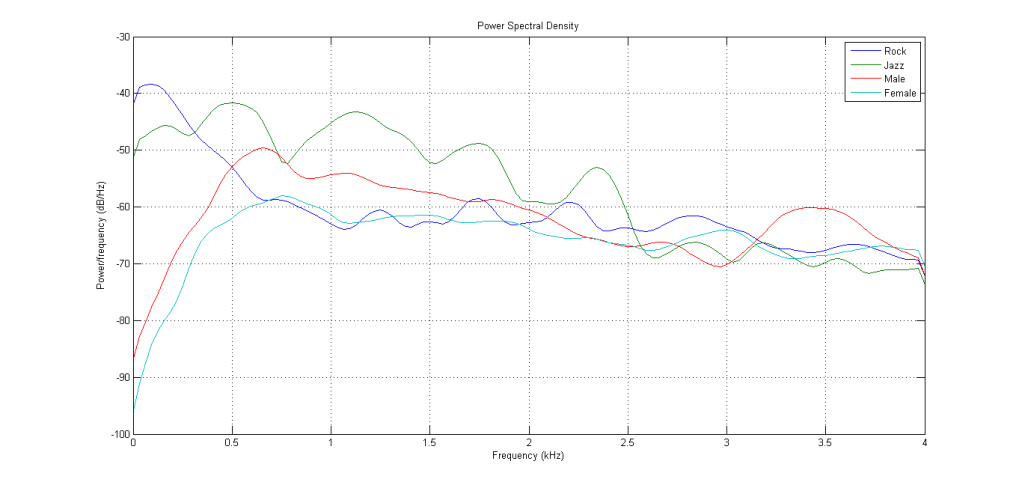
I've tried to use the MATLAB function , PSD, to plot the spectral but I am getting a different plot instead. Note that the data used for both the plots are the same.

plot obtained using PSD function in MATLAB: http://i1233.photobucket.com/albums/ff396/sakurayen/Plot/PowerSpectralDensityofRJMF.png

Thanks!

sakuragurl
  • 11
  • 3
  • You might find one of my old answers to a different question informative http://stackoverflow.com/questions/9694297/matlab-fft-xaxis-limits-messing-up-and-fftshift/9699983#9699983 – learnvst Sep 05 '12 at 15:00
  • try [periodogram](http://www.mathworks.com/help/toolbox/signal/ref/periodogram.html) or see [here](http://www.mathworks.com/support/tech-notes/1700/1702.html) – chaohuang Sep 05 '12 at 15:17
  • Thank you for the replies @learnvst and chaohuang,I have tested both the methods suggested. I was trying to find a way to upload the image after I had some problem with photobucket. I managed to obtain a plot like this after following learnvst's link after modifying some parameters: http://img507.imageshack.us/img507/9610/rjmf.png It's quite similar to the plot I want. By the way, is the y-axis of the plot in dB or just power? I tested the periodogram and the method in the link given by chaohuang but I'm not getting the desired results. Thanks for the help though. I really appreciate it! – sakuragurl Sep 05 '12 at 15:55

0 Answers0