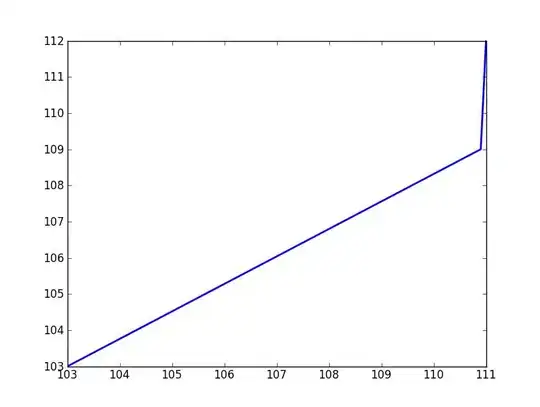
I have a .dat file that contains two columns of numbers so it looks something like this:
111    112
110.9  109
103    103
and so on.
I want to plot the two columns against one another. I have never dealt with a .dat file before so I am not sure where to start.
So far I figured out that numpy has something I can use to call.
data = numpy.loadtxt('data.DAT')
but I'm not sure where to go from here. Any ideas?