6

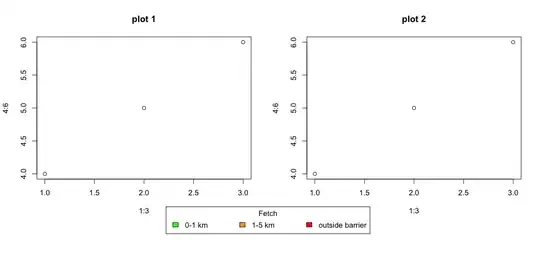
I would like to centre a common legend below two plots. I have used xpd=TRUE to allow for printing outside the plot itself and oma to create space for the legend. However the legend will not move horizonatally and gets clipped 'early' vertically. Any advice?

quartz(title="PCoA",12,6)
par(mfrow=c(1,2),oma=c(5,0,0,0),xpd=TRUE)

plot(1:3,4:6,main="plot 1")

plot(1:3,4:6,main="plot 2")


# Clips the plot    
legend(1,3.5,ncol=3,c("0-1 km","1-5 km","outside barrier"),fill=c("green","orange","red"), title="Fetch")

# Won't let me move the legend sideways 
legend(0,3.5,ncol=3,c("0-1 km","1-5 km","outside barrier"),fill=c("green","orange","red"), title="Fetch")

enter image description here

UPDATE

With the solution below it cuts of the edge of the graph which becomes visible by changing the dimension of the figure by dragging the edge (see below). Any ideas what might be going on?

enter image description here

enter image description here

Elizabeth
  • 6,391
  • 17
  • 62
  • 90
  • In addition to the solutions listed below, **for stable results, you should [use another device](https://stackoverflow.com/q/7144118/6574038)** rather than messing around with your IDE's preview window and trying to export graphics from there. – jay.sf May 14 '22 at 12:07

2 Answers2

19

Rather than using par=mfrow(...) I suggest you use layout().

This allows you to specify a matrix with plot positions:

layout(matrix(c(1,2,3,3), ncol=2, byrow=TRUE), heights=c(4, 1))

par(mai=rep(0.5, 4))
plot(1:3,4:6,main="plot 1")
plot(1:3,4:6,main="plot 2")

par(mai=c(0,0,0,0))
plot.new()
legend(x="center", ncol=3,legend=c("0-1 km","1-5 km","outside barrier"),
       fill=c("green","orange","red"), title="Fetch")

enter image description here

Andrie
  • 176,377
  • 47
  • 447
  • 496
  • 1
    Thanks again for you answer. I seem to be running in to trouble with this solution as it cuts off the edge of the graph (see right hand of graph to the right in update). If I 'squash' the graph the point becomes visible. I am using the same setting as you have shown above. Any idea what may be going on? – Elizabeth Sep 18 '12 at 12:59
  • I presume you have already looked at `lattice` or `ggplot` to achieve the same effect with facets? That's what I would do, instead of faffing about with manual placement of legends. – Andrie Sep 18 '12 at 13:57
  • Hmm..no I am just using layout() as suggested above. Should I abandon the approach above and use lattice instead? – Elizabeth Sep 18 '12 at 14:19
  • Probably. Or ggplot. (IMHO). But it depends on your problem. These packages are great for data with different facets. clearly if you want to create completely different plots with a common legend you'll run into the same problem. – Andrie Sep 18 '12 at 14:24
  • x- and y-labels seem to not show when plotting like this, for some reason. – paul_dg Nov 18 '15 at 14:05
6

par(xpd=NA) is more what you're looking for. Extract from the ?par help page:

xpd
A logical value or NA. If FALSE, all plotting is clipped to the plot region, if TRUE, all plotting is clipped to the figure region, and if NA, all plotting is clipped to the device region. See also clip.

Indeed, you want it to be clipped to the device region and not the figure region (see, for instance, this blog entry for a graphical explanation of the differences between the plot, the figure and the device regions).

quartz(title="PCoA",12,6)
par(mfrow=c(1,2),oma=c(5,0,0,0),xpd=NA)

plot(1:3,4:6,main="plot 1")

plot(1:3,4:6,main="plot 2")
legend(-0.5,3.5,ncol=3,c("0-1 km","1-5 km","outside barrier"), 
    fill=c("green","orange","red"), title="Fetch")

enter image description here

plannapus
  • 18,529
  • 4
  • 72
  • 94