https://github.com/mbostock/d3/wiki/Stack-Layout
http://mbostock.github.com/d3/ex/stream.html
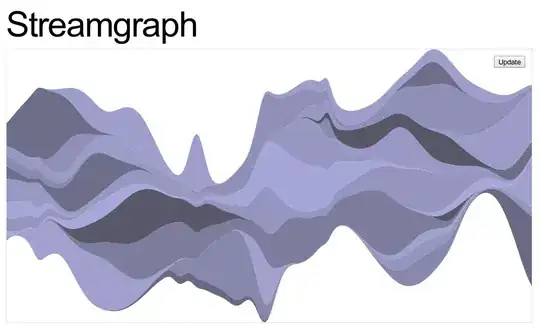
I'm trying to make a streamgraph with D3.js. Looking at the example, we see that the data is formulated through the helper function stream_layers(n, m). In this example an array is returned as described in the API. The API describes input x, y and y0. But the example uses x, y0, y1.
My dataset is formulated similarly to the one described in the API:
{
    "name": "apples",
    "values": [
      { "year": -2000, "y":  91},
      { "year": -1950, "y": 290}
 ]
},
{
  "name": "oranges",
  "values": [
    { "year": -2000, "y":  9},
    { "year": -1950, "y": 49}
  ]
}
What would a helper function that stacks this dataset look like? The example returns a 3D array (one dimension for the number of layers, one for the number of samples m and one for the y-values at each sample).