3

I have a question with labeling a plot in Mathematica. I will describe my problem.

I have a function like this.

y = 4 x / L + 2

I want to draw a graph of y vs. x. And also,I have

L={10,20,30,40}

When I write a code like below,

Plot[y, {x, 0, 100}, 
    ImageSize -> Scaled[1.0], PlotLabel ->  Style["y vs X ", FontSize -> 18]]

I have four different plots in the same graph. I want to know how to label each plot with their relavant L value.

Mr.Wizard
  • 24,179
  • 5
  • 44
  • 125
TMH
  • 134
  • 1
  • 8

2 Answers2

4

You can label the lines as you like using this method, based on my earlier post here. After labelling, the plot without dynamic content can be found set to plainplot.

It works by turning each line into a self-labelling button. You can modify labels for different labels.

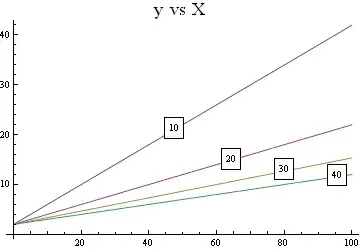
l = {10, 20, 30, 40};
y[x_, s_] := 4 x/s + 2

plot = Plot[Evaluate@Table[y[x, u], {u, l}], {x, 0, 100},
   PlotLabel -> Style["y vs X ", FontSize -> 18]];

pos = Position[plot, _Line];
Array[(line[#] = plot[[Sequence @@ pos[[#]]]]) &, Length@l];
AddLabel[label_] := Module[{},
  AppendTo[plot[[1]], Inset[Framed[label, Background -> White], pt]];
  (* Removing buttons for final plot *)
  plainplot = plot;
  Array[
   (plainplot[[Sequence @@ pos[[#]]]] =
      plainplot[[Sequence @@ Append[pos[[#]], 1]]]) &, Length@l]]
labels = ToString /@ l;
Array[
  (plot[[Sequence @@ pos[[#]]]] =
     Button[line[#], AddLabel[labels[[#]]]]) &, Length@l];
Dynamic[EventHandler[plot,
  "MouseDown" :> (pt = MousePosition["Graphics"])]]

enter image description here

Community
  • 1
  • 1
Chris Degnen
  • 8,443
  • 2
  • 23
  • 40
  • http://mathematica.stackexchange.com/a/4028/193 and http://mathematica.stackexchange.com/questions/4444/labeling-individual-curves-in-mathematica and – Dr. belisarius Sep 14 '12 at 19:30
  • Thank you so much Mr. Wizard. Could you please tell me how to label them like "l=10",....and I want to remove these small boxes. I am beginner in Mathematica. Really appreciate your help on this. – TMH Mar 06 '13 at 03:39
  • @Thakshila - You could change the `Inset` to `Inset[Framed["l = " <> ToString[label], Background -> White, FrameStyle -> None], pt]` or (to move the labels by a uniform displacement) `Inset["l = " <> ToString[label] <> " \n", pt]` – Chris Degnen Mar 06 '13 at 09:36
  • @ChrisDegnen When I run this code, it doesn't come out with any label. Could you explain the reason for that? – TMH Mar 07 '13 at 04:36
3
l = {10, 20, 30, 40}
y[x_, s_] := 4 x/s + 2
<< PlotLegends`

Plot[Evaluate@Table[y[x, u], {u, l}], {x, 0, 100}, 
 ImageSize -> Scaled[1.0], 
 PlotLabel -> Style["y vs X ", FontSize -> 18], 
 PlotLegend -> ("L = " <> ToString@# & /@ l)]

Mathematica graphics

Dr. belisarius
  • 60,527
  • 15
  • 115
  • 190
  • Thank you belisarius. When I print this plot, others cannot see the color.That's the problem. – TMH Mar 06 '13 at 03:40