8

I'm trying to use facet_grid or facet_wrap in conjunction with geom_raster. However, in each panel, the z aesthetic is on a different scale. For example,

##Data at end of question
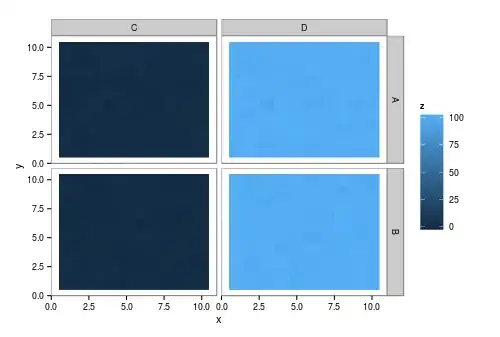
ggplot(dd, aes(x,y)) +
    geom_raster(aes(fill=z)) +
    facet_grid(type ~ var)

gives

enter image description here.

However, since the average values of C and D are around 0 and 100 respectively, we lose a lot of resolution. You could also try:

##Change C to D to get other panel
ggplot(subset(dd, var=="C"), aes(x,y))+
    geom_raster(aes(fill=z)) + 
    facet_grid(type ~ var) + 
    theme(legend.position="bottom") 

which gives

enter image description here

and

enter image description here

but I now have two y strips.

Question

  1. Can I alter the first plot to give two legends for the fill aesthetic?
  2. Or, if I do two separate graphs, can I remove the y strip on one of the plots to allow me to press them together - messing about with the theme, suggests this isn't possible.

Data

Data to reproduce graphs

dd = expand.grid(x=1:10, y=1:10)
dd = data.frame(dd, type=rep(LETTERS[1:2], each=100), 
           var =rep(c("C", "D"), each=200) )
dd$z = rnorm(400, rep(c(0, 100), each=200))
csgillespie
  • 59,189
  • 14
  • 150
  • 185

1 Answers1

7

What about this:

enter image description here

library(gridExtra)
p1 <- ggplot(subset(dd, var=="C"), aes(x,y))+
  geom_raster(aes(fill=z)) + facet_grid(type ~ var) + 
  theme(legend.position="bottom", plot.margin = unit(c(1,-1,1,0.2), "line"))
p2 <- ggplot(subset(dd, var=="D"), aes(x,y))+
  geom_raster(aes(fill=z)) + facet_grid(type ~ var) + 
  theme(legend.position="bottom", plot.margin = unit(c(1,1,1,-0.8), "line"),
        axis.text.y = element_blank(), axis.ticks.y = element_blank()) + ylab("")
grid.arrange(arrangeGrob(p1, p2, nrow = 1))

also you might want to play around with plot.margin. And it seems that a negative answer to your first question can be found here.

Julius Vainora
  • 47,421
  • 9
  • 90
  • 102
  • Thanks. Would playing about with `plot.margin` enable me to get both plots the same size? Just now the plot area of the left is smaller than the one on the right. – csgillespie Sep 24 '12 at 16:35
  • @csgillespie, it seems so, I edited the answer, it looks better now. – Julius Vainora Sep 24 '12 at 16:44
  • Thanks. That's pretty much the same solution I came up with, **but** I didn't think of shifting the panel label off the side of the screen - neat. The solution is a bit hacky, but I suspect it's the best solution. BTW, using `+ ylab(NULL)` doesn't display any y-axis label, which might make thing a bit easier. Thanks. – csgillespie Sep 25 '12 at 08:00