-2

i am trying to generate/simulate a set of synthetic/ simulated data set to generate a synthetic blood flow image in matlab. but i dont know how or where to starts from...

i know i should use the mesh function but how do i make it so it could be in time dimension?

I will be very thankful if anybody could help/ guide me through. I want to generate a data set of size 25x25x10x4. Which is X x Y x t x V. The image should be something similar to this:
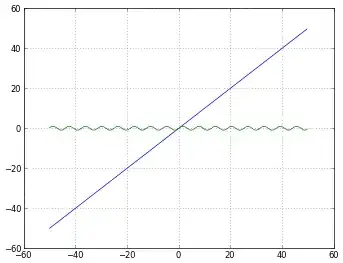
this is an image of supposedly vessel in the brain

or like this:

enter image description here

thank you in advance!

BoltClock
  • 700,868
  • 160
  • 1,392
  • 1,356
mizzue
  • 25
  • 1
  • 5
  • if you are significantly changing the original post, please indicate that as an "update", or provide further clarifications. Otherwise the provided answers may no longer make sense. – gevang Sep 25 '12 at 02:44
  • 1
    Please stop destroying your question. Not only will the answers no longer make sense, it is also disrespectful and undermines the effort people put in to help you. – BoltClock Sep 25 '12 at 08:28

2 Answers2

3

Dataset #1:

Use your favorite line representation (polar, linear, whatever) and randomly generate the parameters for your line. E.g. if you go for y = mx + c, randomly generate m and c. Now that you have defined your line, use this SO method to draw it on the image.

enter image description here

Dataset #2:

They look like 2D Gaussians. Use mvnpdf in the following manner.

[X Y] = meshgrid(x_range,y_range);
Z = reshape(  mvnpdf([X(:) Y(:)],MU,SIGMA)   ,size(X));
imagesc(Z);

Use some randomly generated MU and SIGMA such that MU lies in x_range and y_range. E.g. x_range = -3:0.1:3;y_range = x_range; and

MU =

0.9575    0.9649

SIGMA =

1.2647    0.3760
0.3760    1.0938

enter image description here

Community
  • 1
  • 1
Jacob
  • 34,255
  • 14
  • 110
  • 165
1

Just to complement @Jacob 's very specific answer, you need a 4D MxNxTxV matrix. In this, according to the post, MxN is the dimension of each image, T is the time dimension, and V is the number of channels or samples per time frame (3 for RGB or >3 for any spectral image).

  • For each T, generate V images.
  • Simulate the V images with random parameters for Dataset #1 and Dataset #2.
  • Put everything in one 4D matrix per Dataset (i.e. using a double for or concatenation)

Replace rand() with generate_image() below, i.e. a function generating random samples of the type of structure you want, according to @Jacob 's suggestions:

M = 25; N = 25;
T = 10; V = 4;

DataSet1 = zeros(M,N,T,V);
DataSet2 = zeros(M,N,T,V);

for t = 1:T
   for v = 1:V
        DataSet1(:,:,t,v) = randn(M,N);
        DataSet2(:,:,t,v) = randn(M,N);
    end
end
gevang
  • 4,994
  • 25
  • 33