I recently launched a new Ruby on Rails application that worked well in development mode. After the launch I have been experiencing the memory being used is constantly increasing:
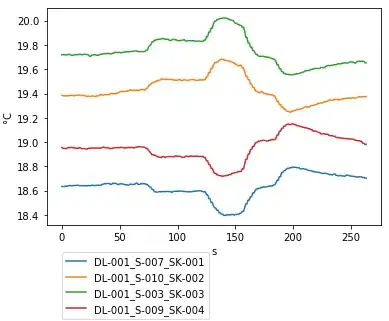
UPDATED: When this screen dump (the one below) from New Relic was taken. I have scheduled a web dyno restart every hour (one out of two web dynos). Thus, it does not reach the 500Mb-crash level and it actually gets a bit of a sig saw pattern. The problem is not at all resolved by this though, only some of the symptoms. As you can see the morning is not so busy but the afternoon is more busy. I made an upload at 11.30 for a small detail, it could not have affected the problem even though it appears as such in the stats.
It could be noted as well that it is the MIN memory that keeps on increasing even though the graph shows AVG memory. Even when the graph seems to go down temporarily in the graph, the min memory stays the same or increases. The MIN memory never decreases!
The app would (without dyno restarts) increase in memory until it reached the maximum level at Heroku and the app crashes with execution expired-types of errors.
I am not a great programmer but I have made a few apps before without having this type of problem.
Troubleshooting performed
A. I thought the problem would lie within the before_filter in the application_controller (Will variables in application controller cause a memory leak in Rails?) but that wasn't the problem.
B. I installed oink but it does not give any results (at all). It creates an oink.log but does not give any results when I run "heroku run oink -m log/oink.log", no matter what threshold.
C. I tried bleak_house but it was deprecated and could not be installed
D. I have googled and read most articles in the topic but I am none the wiser.
E. I would love to test memprof but I can't install it (I have Ruby 1.9x and don't really know how to downgrade it to 1.8x)
My questions:
Q1. What I really would love to know is the name(s) of the variable(s) that are increasing for each request, or at least which controller is using the most memory.
Q2. Will a controller as the below code increase in memory?
related_feed_categories = []
@gift.tags.each do |tag|
  tag.category_connections.each do |cc|
    related_feed_categories << cc.category_from_feed
  end
end
(sorry, SO won't re-format the code to be easily readable for some reason).
Do I need to "kill off" related_feed_categories with "related_feed_categories = nil" afterwards or does the Garbage Collector handle that?
Q3. What would be my major things to look for? Right now I can't narrow it down AT ALL. I don't know which part of the code to look deeper into, and I don't really know what to look for.
Q4. In case I really cannot solve the problem. Are there any online consulting service where I can send my code and get them to find the problem?
Thanks!
UPDATED. After receiving comments it could have to do with sessions. This is a part of the code that I guess could be bad:
# Create sessions for last generation
friend_data_arr = [@generator.age, @generator.price_low, @generator.price_high]
friend_positive_tags_arr = []
friend_negative_tags_arr = []
friend_positive_tags_arr << @positive_tags
friend_negative_tags_arr << @negative_tags
session["last_generator"] = [friend_data_arr, friend_positive_tags_arr, friend_negative_tags_arr]

# Clean variables
friend_data_arr = nil
friend_positive_tags_arr = nil
friend_negative_tags_arr = nil
it is used in the generator#show controller. When some gifts have been generated through my gift-generating-engine I save the input in a session (in case they want to use that info in a later stage). I never kill or expire these sessions so in case this could cause memory increase.
Updated again: I removed this piece of code but the memory still increases, so I guess this part is not it but similar code might causing the error?