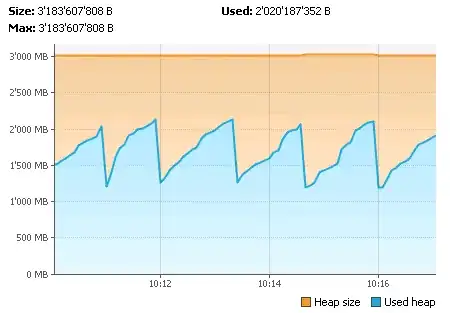
With VisualVM I am observing the following heap usage on a JBoss server:
The server is started with the following (relevant) JVM options:
-Xrs -Xms3072m -Xmx3072m -XX:MaxPermSize=512m -XX:+UseParallelOldGC -Dsun.rmi.dgc.client.gcInterval=3600000 -Dsun.rmi.dgc.server.gcInterval=3600000
And we currently also have enabled GC logging:
-XX:+PrintGC -XX:+PrintGCTimeStamps -XX:+PrintGCDetails -Xloggc:log\gc.log
Basically I am happy with the observed pattern, since it looks like we don't have any memory leaks (the pattern repeats itself over days).
However I am wondering if there is room for optimization?
First of all, I don't understand why the garbage collection already kicks in when the heap usage reaches about 2GB? It looks to me like it could kick in later since the heap would have 3GB available?
Further more I would be interested in tips regarding the observed heap usage pattern and the used JVM options:
Does the observed pattern allow me to draw conclusions about the used GC strategy (UseParallelOldGC)? Ist this strategy the right one, or should I try to use another one given the observed heap usage?
Can I optimize the GC process, so that the full heap size (3GB) is used?
Right now it looks like the full 3GB are never used, should I reduce the Xms/Xmx to 2.5GB?
Are there any obvious GC optimizations that I am missing? Like tuning -XX:NewSize or -XX:NewRatio?
Any other tips that come to mind?
Thanks!