I am new to learning R. I wanted to know how I can asssign a categorical value to observations I have read in as a dataframe. For eg I have data for m variables from n samples and I want to assign some samples as group 1 and some samples as group 2 and so on. Also, how can I visualise different groups in different colors when I plot them?
Asked
Active
Viewed 1,293 times
2
-
Welcome to R and SO. To help get you good answers, please try to post a [reproducible example](http://stackoverflow.com/q/5963269). Also, your question consists of two questions, only one of which is mentioned in the question title. – BenBarnes Oct 10 '12 at 08:01
-
This depends quite a bit on how you want to categorize the observations, and whether the observations are discrete (in which case they are already categories) or continuous (in which case you will have to decide what criterion you want to use to categorize them by). – Drew Steen Oct 10 '12 at 16:51
1 Answers
5
Let's say you have the following data:
spam = data.frame(value = runif(100))
you can assign random group membership like this:
spam[["group"]] = sample(c("group1", "group2"), nrow(spam), replace = TRUE)

> head(spam)
      value  group
1 0.1385715 group1
2 0.1785452 group1
3 0.7407510 group2
4 0.5867080 group1
5 0.1514461 group1
6 0.3009905 group1
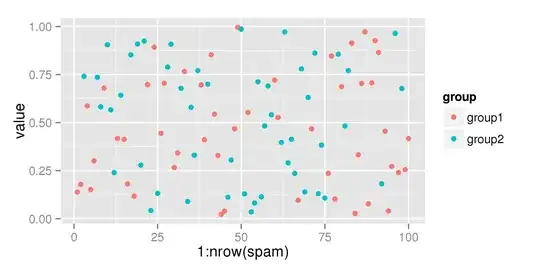
Plotting the groups with different colors can easily be done using ggplot2:
require(ggplot2)
ggplot(aes(x = 1:nrow(spam), y = value, color = group), data = spam) +
  geom_point()
Paul Hiemstra
- 59,984
- 12
- 142
- 149
-
What if I know what groups my data points belong to and I want to assign specific group identity to all the data points and color them differently ? – Anurag Mishra Oct 11 '12 at 09:34
-
Just create the `spam[["group"]]` column with the correct names. – Paul Hiemstra Oct 11 '12 at 09:36