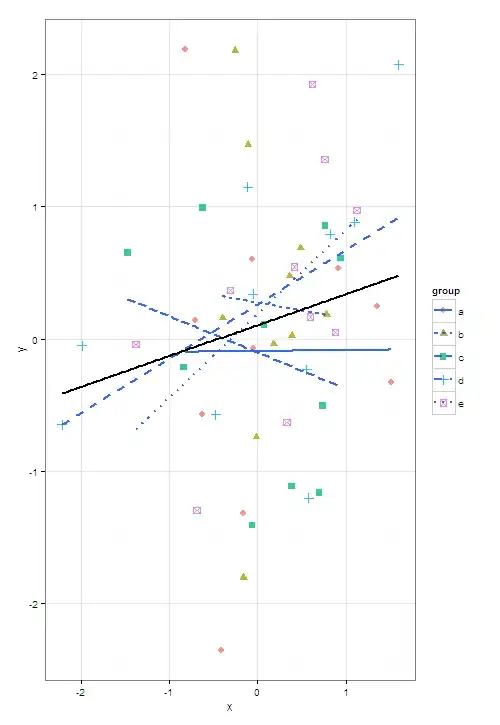
I am new to ggplot2 and have problem displaying the regression line for the entire data set together with the regression lines for each group.
So far I can plot regression line based on the group, but I have no success in getting the regression line for the entire data-set on the same plot.
I want all the regression lines with different line style so that they can be easily identified in black and white print.
Here is my code so far:
ggplot(alldata, aes(y = y, x = x, colour= group, shape = group )) +
  geom_point(size = 3, alpha = .8) +
  geom_smooth(method = "lm", fill = NA , size = 1)