scons --profile + snakeviz
This combination showed me exactly what the bottlneck was.
--profile outputs a binary file in cProfile format, which is present in the stdlib.
snakeviz is then an awesome visualization tool to quickly view that file in a GUI:
scons --profile f.prof
pip install -u snakeviz
snakeviz f.prof
The output looked like this:
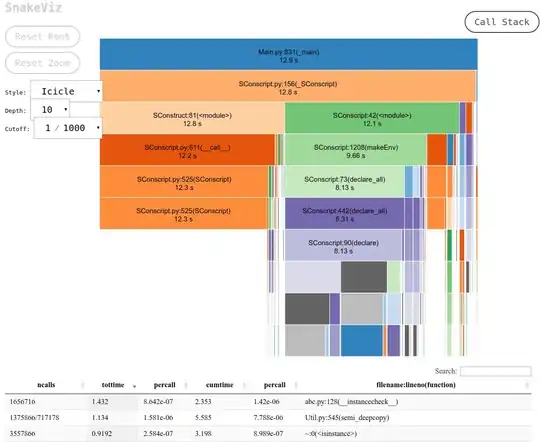
and you can hover each box to see the full path to the file that contains the function.
Question in a more general Python context: Is there any simple way to benchmark python script?
--debug + ts -s
This didn't solve my specific problem, but it can often give you some ideas:
time scons --debug=count,duplicate,explain,findlibs,includes,memoizer,memory,objects,prepare,presub,stacktrace,time |
  ts -s | tee f
Sample output excerpt that showed where I had a huge time gap between 2 and 10 seconds, which is where I tried to focus:
00:00:02 SConscript:/data/gem5/master3/build/ARM/sim/power/SConscript  took 1.556 ms
00:00:02 dup: relinking variant 'build/ARM/sim/probe/SConscript' from 'src/sim/probe/SConscript'
00:00:02 Building build/ARM/sim/probe/SConscript with action:
00:00:02   UnlinkFunc(target, source, env)
00:00:02 Building build/ARM/sim/probe/SConscript with action:
00:00:02   LinkFunc(target, source, env)
00:00:02 SConscript:/data/gem5/master3/build/ARM/sim/probe/SConscript  took 0.401 ms
00:00:10 SConscript:/data/gem5/master3/build/ARM/tests/opt/SConscript  took 98.225 ms
00:00:10 SConscript:/data/gem5/master3/build/ARM/SConscript  took 8885.387 ms
00:00:10 SConscript:/data/gem5/master3/SConstruct  took 9409.641 ms
00:00:10 scons: done reading SConscript files.
00:00:10 scons: Building targets ...
Tested in scons 3.0.1, Ubuntu 18.04.
See also
