28

Given an image and a set of labels attached to particular points on the image, I'm looking for an algorithm to lay out the labels to the sides of the image with certain constraints (roughly same number of labels on each side, labels roughly equidistant, lines connecting the labels to their respective points with no lines crossing).

Now, an approximate solution can typically be found quite naively by ordering the labels by Y coordinate (of the point they refer to), as in this example (proof of concept only, please ignore accuracy or otherwise of actual data!).

Now to satisfy the condition of no crossings, some ideas that occurred to me:

  • use a genetic algorithm to find an ordering of labels with no crossovers;
  • use another method (e.g. dynamic programming algorithm) to search for such an ordering;
  • use one of the above algorithms, allowing for variations in the spacing as well as ordering, to find the solution that minimises number of crossings and variation from even spacing;
  • maybe there are criteria I can use to brute search through every possible ordering of the labels within certain criteria (do not re-order two labels if their distance is greater than X);
  • if all else fails, just try millions of random orderings/spacing offsets and take the one that gives the minimum crossings/spacing variation. (Advantage: straightforward to program and will probably find a good enough solution; slight disadvantage, though not a show-stopper: maybe can't then run it on the fly during the application to allow user to change layout/size of the image.)

Before I embark on one of these, I would just welcome some other people's input: has anybody else experience with a similar problem and have any information to report on the success/failure of any of the above methods, or if they have a better/simpler solution that isn't occurring to me? Thanks for your input!

Neil Coffey
  • 21,615
  • 7
  • 62
  • 83
  • if we talk about only algorithm(not programing language) you can draw line one by one and save all lines(every points) x,y coordination. now on every new line check every point's(x,y) if it cross you can put one curve(looks like reverse "U") and then again join your line after crossing other-line. – Jubin Patel Nov 15 '12 at 10:24
  • 1
    Don't you feel the actual problem is similar to PCB routing? There are several well-defined algorithms. – Renat Gilmanov Nov 16 '12 at 19:16
  • Yes, I hadn't considered it that way, but maybe you could conceptualise it as a sub-set of a similar problem. If you have a specific PCB algorithm that you think could be adapted, your answer would be very welcome. – Neil Coffey Nov 16 '12 at 20:43
  • Just to say many thanks for everybody's input on this -- many of the answers actually contain some interesting points that I'll no doubt be considering. – Neil Coffey Nov 18 '12 at 00:32

7 Answers7

14

Lucas Bradsheet's honours thesis Labelling Maps using Multi-Objective Evolutionary Algorithms has quite a good discussion of this.

First off, this paper creates usable metrics for a number of metrics of labelling quality.

For example, clarity (how obvious the mapping between sites and labels was): clarity(s)=rs+rs1/rt
where rs is the distance between a site and its label and rt is the distance between a site and there closest other label).

It also has useful metrics for the conflicts between labels, sites and borders, as well as for measuring the density and symmetry of labels. Bradsheet then uses a multiple objective genetic algorithm to generate a "Pareto frontier" of feasible solutions. It also includes information about how he mutated the individuals, and some notes on improving the speed of the algorithm.

There's a lot of detail in it, and it should provide some good food for thought.

Mehran
  • 15,593
  • 27
  • 122
  • 221
Joel Rein
  • 3,608
  • 1
  • 26
  • 32
10

Let's forget about information design for a moment. This tasks recalls some memories related to PCB routing algorithms. Actually there are a lot of common requirements, including:

  1. intersections optimization
  2. size optimization
  3. gaps optimization

So, it could be possible to turn the initial task into something similar to PCB routing.

There are a lot of information available, but I would suggest to look through Algorithmic studies on PCB routing by Tan Yan.

It provides a lot of details and dozens of hints.

Adaptation for the current task

The idea is to treat markers on the image and labels as two sets of pins and use escape routing to solve the task. Usually the PCB area is represented as an array of pins. Same can be done to the image with possible optimizations:

  1. avoid low contrast areas
  2. avoid text boxes if any
  3. etc

So the task can be reduced to "routing in case of unused pins"

enter image description here

Final result can be really close to the requested style:

enter image description here

Algorithmic studies on PCB routing by Tan Yan is a good place to continue.

Additional notes

I chn change the style of the drawing a little bit, in order to accentuate the similarity.

enter image description here

It should not be a big problem to do some reverse transformation, keeping the good look and readability.

enter image description here

Anyway, adepts of simplicity (like me, for example) can spend several minutes and invent something better (or something different):

enter image description here

As for me, curves do not look like a complete solution, at least on this stage. Anyway, I've just tried to show there is room for enhancements, so PCB routing approach can be considered as an option.

Renat Gilmanov
  • 17,735
  • 5
  • 39
  • 56
8

One option is to turn it into an integer programming problem.

Lets say you have n points and n corresponding labels distributed around the outside of the diagram.

The number of possible lines is n^2, if we look at all possible intersections, there are less than n^4 intersections (if all possible lines were displayed).

In our integer programming problem we add the following constraints:

(to decide if a line is switched on (i.e. displayed to the screen) )

  1. For each point on the diagram, only one of the possible n lines connecting to it is to be switched on.

  2. For each label, only one of the possible n lines connecting to it is to be switched on.

  3. For each pair of intersecting line segments line1 and line2, only zero or one of these lines may be switched on.

  4. Optionally, we can minimize the total distance of all the switched on lines. This enhances aesthetics.

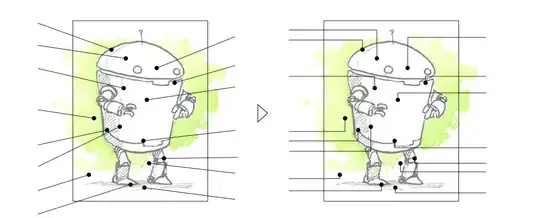
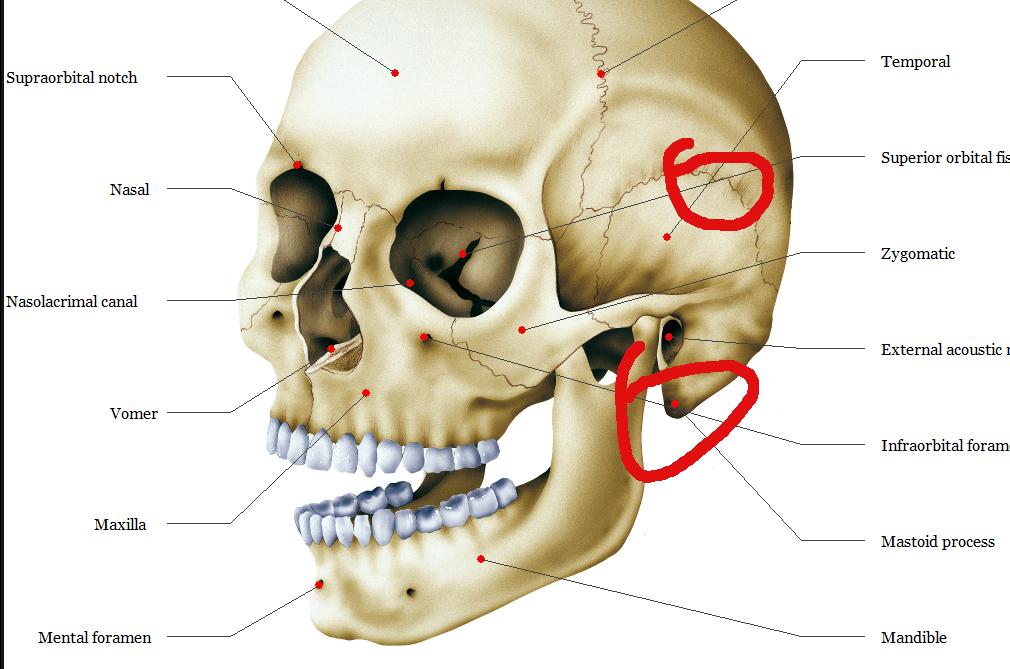
When all of these constraints hold at the same time, we have a solution:

enter image description here

The code below produced the above diagram for 24 random points.

Once You start to get more than 15 or so points, the run time of the program will start to slow.

I used the PULP package with its default solver. I used PyGame for the display.

Here is the code:

__author__ = 'Robert'

import pygame
pygame.font.init()
import pulp
from random import randint

class Line():
    def __init__(self, p1, p2):
        self.p1 = p1
        self.p2 = p2
        self.length = (p1[0] - p2[0])**2 + (p1[1] - p2[1])**2

    def intersect(self, line2):
        #Copied some equations for wikipedia. Not sure if this is the best way to check intersection.
        x1, y1 = self.p1
        x2, y2 = self.p2
        x3, y3 = line2.p1
        x4, y4 = line2.p2
        xtop = (x1*y2-y1*x2)*(x3-x4)-(x1-x2)*(x3*y4-y3*x4)
        xbottom = (x1-x2)*(y3-y4) - (y1-y2)*(x3-x4)
        ytop = (x1*y2-y1*x2)*(y3-y4)-(y1-y2)*(x3*y4-y3*x4)
        ybottom = xbottom
        if xbottom == 0:
            #lines are parallel. Can only intersect if they are the same line. I'm not checking that however,
            #which means there could be a rare bug that occurs if more than 3 points line up.
            if self.p1 in (line2.p1, line2.p2) or self.p2 in (line2.p1, line2.p2):
                return True
            return False
        x = float(xtop) / xbottom
        y = float(ytop) / ybottom
        if min(x1, x2) <= x <= max(x1, x2) and min(x3, x4) <= x <= max(x3, x4):
            if min(y1, y2) <= y <= max(y1, y2) and min(y3, y4) <= y <= max(y3, y4):
                return True
        return False

def solver(lines):
    #returns best line matching
    lines = list(lines)
    prob = pulp.LpProblem("diagram labelling finder", pulp.LpMinimize)

    label_points = {} #a point at each label
    points = {} #points on the image
    line_variables = {}
    variable_to_line = {}

    for line in lines:
        point, label_point = line.p1, line.p2
        if label_point not in label_points:
            label_points[label_point] = []
        if point not in points:
            points[point] = []
        line_on = pulp.LpVariable("point{0}-point{1}".format(point, label_point),
            lowBound=0, upBound=1, cat=pulp.LpInteger) #variable controls if line used or not
        label_points[label_point].append(line_on)
        points[point].append(line_on)
        line_variables[line] = line_on
        variable_to_line[line_on] = line

    for lines_to_point in points.itervalues():
        prob += sum(lines_to_point) == 1 #1 label to each point..

    for lines_to_label in label_points.itervalues():
        prob += sum(lines_to_label) == 1 #1 point for each label.

    for line1 in lines:
        for line2 in lines:
            if line1 > line2 and line1.intersect(line2):
                line1_on = line_variables[line1]
                line2_on = line_variables[line2]
                prob += line1_on + line2_on  <= 1 #only switch one on.

    #minimize length of switched on lines:
    prob += sum(i.length * line_variables[i] for i in lines)

    prob.solve()
    print prob.solutionTime
    print pulp.LpStatus[prob.status] #should say "Optimal"
    print len(prob.variables())

    for line_on, line in variable_to_line.iteritems():
        if line_on.varValue > 0:
            yield line #yield the lines that are switched on

class Diagram():
    def __init__(self, num_points=20, width=700, height=800, offset=150):
        assert(num_points % 2 == 0) #if even then labels align nicer (-:
        self.background_colour = (255,255,255)
        self.width, self.height = width, height
        self.screen = pygame.display.set_mode((width, height))
        pygame.display.set_caption('Diagram Labeling')
        self.screen.fill(self.background_colour)
        self.offset = offset
        self.points = list(self.get_points(num_points))
        self.num_points = num_points
        self.font_size = min((self.height - 2 * self.offset)//num_points, self.offset//4)

    def get_points(self, n):
        for i in range(n):
            x = randint(self.offset, self.width - self.offset)
            y = randint(self.offset, self.height - self.offset)
            yield (x, y)

    def display_outline(self):
        w, h = self.width, self.height
        o = self.offset
        outline1 = [(o, o), (w - o, o), (w - o, h - o), (o, h - o)]
        pygame.draw.lines(self.screen, (0, 100, 100), True, outline1, 1)
        o = self.offset - self.offset//4
        outline2 = [(o, o), (w - o, o), (w - o, h - o), (o, h - o)]
        pygame.draw.lines(self.screen, (0, 200, 0), True, outline2, 1)

    def display_points(self, color=(100, 100, 0), radius=3):
        for point in self.points:
            pygame.draw.circle(self.screen, color, point, radius, 2)

    def get_label_heights(self):
        for i in range((self.num_points + 1)//2):
            yield self.offset + 2 * i * self.font_size

    def get_label_endpoints(self):
        for y in self.get_label_heights():
            yield (self.offset, y)
            yield (self.width - self.offset, y)

    def get_all_lines(self):
        for point in self.points:
            for end_point in self.get_label_endpoints():
                yield Line(point, end_point)


    def display_label_lines(self, lines):
        for line in lines:
            pygame.draw.line(self.screen, (255, 0, 0), line.p1, line.p2, 1)

    def display_labels(self):
        myfont = pygame.font.SysFont("Comic Sans MS", self.font_size)
        label = myfont.render("label", True, (155, 155, 155))
        for y in self.get_label_heights():
            self.screen.blit(label, (self.offset//4 - 10, y - self.font_size//2))
            pygame.draw.line(self.screen, (255, 0, 0), (self.offset -  self.offset//4, y), (self.offset, y), 1)
        for y in self.get_label_heights():
            self.screen.blit(label, (self.width - 2*self.offset//3, y - self.font_size//2))
            pygame.draw.line(self.screen, (255, 0, 0), (self.width - self.offset + self.offset//4, y), (self.width - self.offset, y), 1)

    def display(self):
        self.display_points()
        self.display_outline()
        self.display_labels()
        #self.display_label_lines(self.get_all_lines())
        self.display_label_lines(solver(self.get_all_lines()))

diagram = Diagram()
diagram.display()

pygame.display.flip()
running = True
while running:
    for event in pygame.event.get():
        if event.type == pygame.QUIT:
            running = False
Rusty Rob
  • 16,489
  • 8
  • 100
  • 116
  • Interesting-- just with the slight problem that you delegate the actual gubbins to a magic library, of course... – Neil Coffey Nov 14 '12 at 14:55
  • 1
    neil i think it's good to make use of a library. however the library is open source. also integer programming is common. you can find many example algorithms for most languages. the important concept here is the formulation of the constraints. now you can use any solver. i only give code as a proof of concept. search google for integer programming. – Rusty Rob Nov 14 '12 at 19:42
  • That's a fair point, and I do like your idea of reformulating the problem as possible lines, switched on/off with certain constraints. It's just that details of details of the solving algorithm are at least equally of interest to me. – Neil Coffey Nov 14 '12 at 21:13
  • 1
    Cheers. I just edited my answer. There is a new image with 24 points and it looks nicer because I added a new "objective function". This objective is to minimize the distance of all the switched on lines. – Rusty Rob Nov 15 '12 at 23:50
8

I think an actual solution of this problem is on the slightly different layer. It doesn't seem to be right idea to start solving algorithmic problem totally ignoring Information design. There is an interesting example found here

Let's identify some important questions:

  1. How is the data best viewed?
  2. Will it confuse people?
  3. Is it readable?
  4. Does it actually help to better understand the picture?

By the way, chaos is really confusing. We like order and predictability. There is no need to introduce additional informational noise to the initial image.

enter image description here

The readability of a graphical message is determined by the content and its presentation. Readability of a message involves the reader’s ability to understand the style of text and pictures. You have that interesting algorithmic task because of the additional "noisy" approach. Remove the chaos -- find better solution :)

enter image description here

Please note, this is just a PoC. The idea is to use only horizontal lines with clear markers. Labels placement is straightforward and deterministic. Several similar ideas can be proposed.

enter image description here

With such approach you can easily balance left-right labels, avoid small vertical gaps between lines, provide optimal vertical density for labels, etc.

EDIT

Ok, let's see how initial process may look.

User story: as a user I want important images to be annotated in order to simplify understanding and increase it's explanatory value.

Important assumptions:

  1. initial image is a primary object for the user
  2. readability is a must

So, the best possible solution is to have annotations but do not have them. (I would really suggest to spend some time reading about the theory of inventive problem solving).

Basically, there should be no obstacles for the user to see the initial picture, but annotations should be right there when needed. It can be slightly confusing, sorry for that.

Do you think intersections issue is the only one behind the following image?

enter image description here

Please note, the actual goal behind the developed approach is to provide two information flows (image and annotations) and help the user to understand everything as fast as possible. By the way, vision memory is also very important.

What are behind human vision:

  1. Selective attention
  2. Familiarity detection
  3. Pattern detection

Do you want to break at least one of these mechanisms? I hope you don't. Because it will make the actual result not very user-friendly.

So what can distract me?

  1. strange lines randomly distributed over the image (random geometric objects are very distractive)
  2. not uniform annotations placement and style
  3. strange complex patterns as a result of final merge of the image and the annotation layer

Why my proposal should be considered?

  1. It has simple pattern, so pattern detection will let the user stop noticing annotations, but see the picture instead
  2. It has uniform design, so familiarity detection will work too
  3. It does not affect initial image so much as other solutions because lines have minimal width.
  4. Lines are horizontal, anti-aliasing is not used, so it saves more information and provides clean result
  5. Finally, it does simplify routing algorithm a lot.

Some additional comments:

  1. Do not use random points to test your algorithms, use simple but yet important cases. You'll see automated solutions sometimes may fail dramatically.
  2. I do not suggest to use approach proposed by me as is. There are a lot of possible enhancements.
  3. What I'm really suggest is to go one level up and do several iterations on the meta-level.

Grouping can be used to deal with the complex case, mentioned by Robert King:

enter image description here

Or I can imagine for a second some point is located slightly above it's default location. But only for a second, because I do not want to break the main processing flow and affect other markers.

enter image description here

Thank you for reading.

Renat Gilmanov
  • 17,735
  • 5
  • 39
  • 56
  • My question *is* nonetheless about the numerical algorithm, though. I'd really already decided on the basic aesthetic criteria similar to those you mention. – Neil Coffey Nov 16 '12 at 17:20
  • Shall I remove my "answer"? Good question, BTW. Thank you. – Renat Gilmanov Nov 16 '12 at 18:22
  • Don't get me wrong -- your answer is still relevant, especially if you can concretise some of the visual constraints you mention -- it's just not focussed primarily on what was the crux of my question. – Neil Coffey Nov 16 '12 at 20:45
  • I agree this does look nice but it would perhaps fail if there were a number of points at a similar height, which could perhaps be a common use case. – Rusty Rob Nov 16 '12 at 23:06
  • @robertking Thank you for the comment. There are several ways to overcome this issue, so I'm really happy it looks nice for you too :) – Renat Gilmanov Nov 17 '12 at 00:48
  • 1
    @NeilCoffey It occurs to me that drawing the diagonal lines at the same y coordinates greatly reduces the chance of getting intersecting lines, hence applying this style simplifies the algorithm by a great deal. Koodos – Jacob Nov 17 '12 at 15:14
5

You can find the center of your diagram, and then draw the lines from the points radially outward from the center. The only way you could have a crossing is if two of the points lie on the same ray, in which case you just shift one of the lines a bit one way, and shift the other a bit the other way, like so:

Centerlines

With only actual parts showing:

All Done

In case there are two or more points colinear with the center, you can shift the lines slightly to the side:

In case of colinearity

While this doen't produce very good multisegment line things, it very clearly labels the diagram. Also, to make it more fisually appealing, it may be better to pick a point for the center that is actually the center of your object, rather than just the center of the point set.

AJMansfield
  • 4,039
  • 3
  • 29
  • 50
  • 1
    It is not that good to have labels on the top and on the bottom. Reasons are: consumed space, hard to use as a figure within some text block, etc. – Renat Gilmanov Nov 16 '12 at 18:26
  • @Renat Gilmanov a border around the entire diagram would at least fix the 'hard to use as a figure within some text block issue' though. – AJMansfield Nov 18 '12 at 20:50
  • It will take so much space and will not look good (only my subjective opinion). – Renat Gilmanov Nov 19 '12 at 14:24
3

I would add one more thing to your prototype - may be it will be acceptable after this:

Iterate through every intersection and swap labels, repeat until there are intersections.

This process is finite, because number of states is finite and every swap reduces sum of all line lengths - so no loop is possible.

maxim1000
  • 6,297
  • 1
  • 23
  • 19
  • Yes, in reality, for any of the algorithms I will probably narrow down the choices by not allowing labels to move 'out of place' (from the order defined by Y coordinates) by more than a few places. – Neil Coffey Nov 13 '12 at 13:25
  • Can you prove this maxim1000? On first glance I assumed swapping two labels could introduce other crossings. – Rusty Rob Nov 13 '12 at 23:53
  • The last line was a proof, I've a bit clarified it. – maxim1000 Nov 14 '12 at 05:37
  • Nice! That's a nice way of thinking about it. I guess there is always a solution then. I wonder how you would work out the time complexity of that. I'm guessing it would be reasonably fast? – Rusty Rob Nov 14 '12 at 08:14
  • Hmmm... The number of states is N^N. Theoretically, in some cases with random choices we could go through all of them. If initial connections are not random, likely, a better estimate can be made... – maxim1000 Nov 14 '12 at 09:49
1

This problem can be cast as graph layout.

I recommend you look at e.g. the Graphviz library. I have not done any experiments, but believe that by expressing the points to be labeled and the labels themselves as nodes and the lead lines as edges, you would get good results.

You would have to express areas where labels should not go as "dummy" nodes not to be overlapped.

Graphvis has bindings for many languages.

Even if Graphviz does not have quite enough flexibility to do exactly what you need, the "Theory" section of that page has references for energy minimization and spring algorithms that can be applied to your problem. The literature on graph layout is enormous.

Gene
  • 46,253
  • 4
  • 58
  • 96
  • i like graph viz. i think its possible to set in concrete the xy positions of the point nodes. however how can you tell graph viz the connected label node must be somewhere on the outside – Rusty Rob Nov 17 '12 at 21:13
  • As I said you have to define a big dummy node covering the whole picture and then tell it not to allow overlaps. I am assuming that the fixed nodes on the diagram will be allowed to overlap and the unconstrained nodes for the labels will then be placed around the outside. If this doesn't work, it will be pretty simple to implement your own energy-based algorithm. See http://en.wikipedia.org/wiki/Force-based_algorithms_(graph_drawing) – Gene Nov 18 '12 at 03:18