7

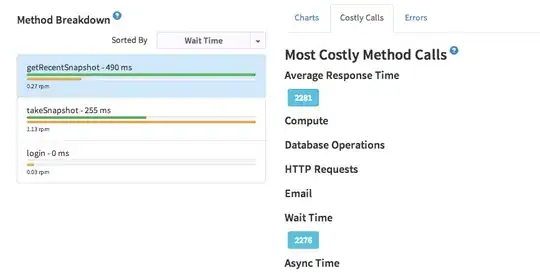
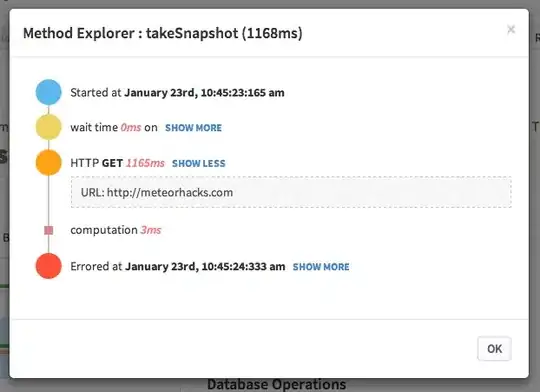
My Meteor application, in server side (node process), is using much more CPU than would be acceptable, and I want to investigate it.

Two simultaneous clients are leading node to use 100% of CPU. It is probably related to a massive use of observers, but I need to investigate it further before changing the whole application.

So, what tool can I use to profile it? How to use it?

zVictor
  • 3,610
  • 3
  • 41
  • 56

5 Answers5

4

The best solution I found is v8-profiler (plus node-inspector).

Install

  1. Go to [Meteor installation folder]/dev_bundle/lib/node_modules.

  2. exec $ npm install v8-profiler there.

  3. Add in your server code:

Meteor.startup(function() {
  profiler = __meteor_bootstrap__.require("v8-profiler")
  Meteor._debug("Server started!");
});

Use

  • Wherever in your app server code you can profile this way:

    profiler.startProfiling("name");                   //begin cpu profiling
    yourCode();
    var cpuProfile = profiler.stopProfiling("name");   //finish cpu profiling
    
  • Do not forget to run node-inspector

Community
  • 1
  • 1
zVictor
  • 3,610
  • 3
  • 41
  • 56
3

You should also take a look at the Meteor-specific Observatory. It's a powerful server- and client-side logging package, with profiling support for arbitrary functions, and "automagical logging of template lifecycle methods, Collection methods (only find is supported so far), and Subscriptions profiling".

Dan Dascalescu
  • 143,271
  • 52
  • 317
  • 404
Paul Young
  • 401
  • 3
  • 10
  • 1
    It sounds a great and beauty logger with something else, but I haven't found profiling capabilities. They just *plan to add other useful objects monitoring, e.g., users once auth is finished, and likely something around Collections as well.*. – zVictor Nov 15 '12 at 19:45
  • This is awesome if you want to profile DDP. Thanks! – benathon Feb 11 '14 at 10:20
3

APM, Application Performance Monitoring, is a Meteor package + cloud service developed by Arunoda Susiripala of MeteorHacks fame. It's in beta right now, and it looks very promising:

calls

From the Costly Calls tab, you can drill into methods and identify those that take longest:

screenshot

This 1-minute tutorial video shows just this identification of costly methods, which is probably what you want.

More screenshots

more screenshots

Dan Dascalescu
  • 143,271
  • 52
  • 317
  • 404
2

NodeTime is a pretty awesome profiling service. It's free to use, which is especially helpful in situations like yours, and is super easy to set-up!

Sdedelbrock
  • 5,192
  • 1
  • 18
  • 13
  • same error: `Error: Cannot find module 'nodetime'` It says to `Add before any other require statement in your application, e.g. at the first line of main module.` So, where should I put it? – zVictor Nov 15 '12 at 17:38
  • I added the require statement in the first line of *Meteor/app/meteor/run.js*, and there are a lot of other requires after that, but **nodetime** is not found. It sounds a importing problem, that may be caused by *Meteorite*. – zVictor Nov 15 '12 at 17:49
  • I found it! The problem is that meteor, in some cases, doesn't share libraries with system, so you should copy new files to *Meteor/dev_bundle/lib/node_modules/nodetime*. Take a look at *admin/generate-dev-bundle.sh* to see it in action. – zVictor Nov 15 '12 at 18:16
2

There's now

console.time('myFunction'); myFunction(); console.timeEnd('myFunction') //Outputs: myFunction: xxxxms

which I just verified that it works using Meteor 1.2. Super simple, easy, and built-in.

JohnAllen
  • 7,317
  • 9
  • 41
  • 65