70

My daughters have made a game not unlike tic-tac-toe. Of course as I played it with them I started brute-forcing it in my head...

So at lunchtime I made a quick little Python script to 'solve' the game. And I wanted to see the results graphically, so I generated a dot file of all legal moves:

I've pasted the data here.

When I try and render it using dot, it takes forever and I abort it after a few hours.

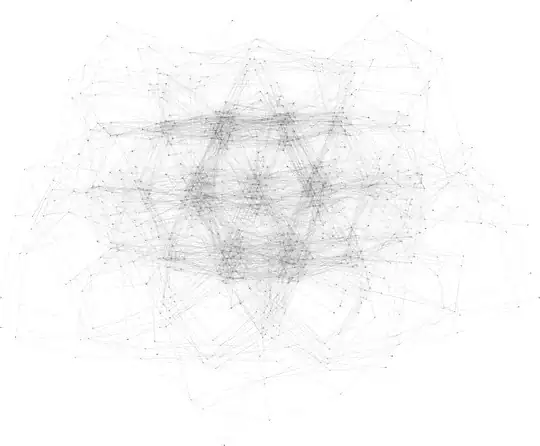
If I render it using neato or sfdp etc, it takes a few seconds or less but the layout is impossible to actually read:

sfdp -x -Tpng data.dot > data.png

sfdp

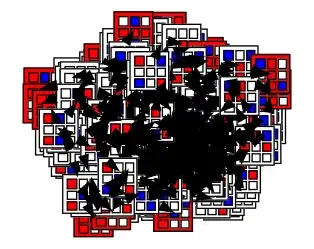
neato -x -Tpng data.dot > data.png

neato

I would be happy for the resulting image to be several megapixels.

How can I lay out and render such a big graph? I am open to non-dot suggestions, like Python libraries that can do the layout too.

(somewhat related link)

Added: my Python script to solve the game and generate the dot file

Will
  • 73,905
  • 40
  • 169
  • 246
  • 2
    How many nodes/edges are there in the graph? You might try http://gephi.org/ – job Nov 16 '12 at 15:18
  • @gephi.org there are 744 nodes and 4361 edges. A dot that I left running has just seg-faulted on this dot-file. – Will Nov 16 '12 at 15:25
  • 1
    @Will Can you give some sort of intuition about execution time for this dataset? – jarandaf Oct 15 '15 at 12:22

4 Answers4

59

Try this:

sfdp -x -Goverlap=scale -Tpng data.dot > data.png

The -Goverlap preserves the layout but uniformly scales things up until there are no more node overlaps. I was able to get a ~77MB PNG that looks like this when you zoom out. enter image description here

job
  • 9,003
  • 7
  • 41
  • 50
  • This looks very promising; despite having 4GB of RAM, I hit swap as soon as I try and view the generated image, though :( Any tips on how to view and resize such large images? – Will Nov 16 '12 at 20:04
  • 2
    @will I was able to open it in GIMP, but it was slow. You can run `dot -Txxx` to get a list of other output formats available. I was also able to specify `-Tx11` to bring up an interactive display of the layout (scroll wheel to zoom, middle-mouse drag to pan around). – job Nov 16 '12 at 20:22
  • 1
    yeah I couldn't get anything to view it, and back-of-an-envelope I ought to have the RAM even at 16bit RGB canvases. I looked briefly at `nip2` too, but couldn't actually work out how to save a file.. I just admitted defeat, blogged about it and moved on! Thx http://williamedwardscoder.tumblr.com/post/35858593837/tic-tac-toe – Will Nov 16 '12 at 20:52
  • 1
    I've seen a few implementations of viewing interfaces for giant images that use similar techniques to Google maps, @Will. Have you tried any of those? After a quick look, I found [GSV](http://mike.teczno.com/giant/pan/) with source code, and a zoomable version of that giant [xkcd comic](http://xkcd-map.rent-a-geek.de/). The GSV page had some code for splitting the image into tiles. – Don Kirkby Nov 19 '12 at 20:24
  • 6
    How can you make it hierarchical view instead of circular? – omega Jan 24 '14 at 19:09
  • Are you able to give some information on how long this took to generate. – Techdragon Aug 25 '14 at 05:46
  • Thanks for the tip. Any static format was too heavy in my case. The only way I managed to visualize it was to generate an xdot as output and then use this: https://github.com/jrfonseca/xdot.py And you can use the command-line as follows so the visualizer respects the layout information embedded into the xdot file: xdot --no-filter output.xdot – Thiago Ganzarolli Nov 19 '18 at 13:57
  • `gdal2tiles.py --processes=8 -p raster data.png`; then you can open the generated directory, run `python3 -m http.server` and open http://0.0.0.0:8000/openlayers.html – Francesco Frassinelli May 12 '22 at 12:34
10

you could still use the neato but modify the .dot file putting: [splines=true overlap=false]

And your file should look like this:

digraph luffarschack {
    graph [splines=true overlap=false];
    node [shape=none]; 
        ...here your nodes;
        ...here your edges;
}

It should work if you just put in the second line "graph [splines=true overlap=false]" and everything else remains the same.

DanielBoloc
  • 167
  • 2
  • 8
  • Early on it printed out "Warning: some nodes with margin (3.20,3.20) touch - falling back to straight line edges", and then after 13 minutes OSX pops up the "force quit" dialog because my system had run out of its 16GB of RAM! I'd love to see the layout this produces if you can manage to run it? – Will Jul 04 '14 at 09:23
  • Done and done...just give me an email adress and I will send you the .svg file (4 MB)...I can't find the upload option in here – DanielBoloc Jul 05 '14 at 15:15
  • there's an email address on my profile page; much appreciated! – Will Jul 05 '14 at 16:25
  • Sorry thought it was publicly visible (varfar at yahoo co uk) – Will Jul 10 '14 at 13:29
  • This helped me but I left out `splines=true` because it was really slow. – jnnnnn Apr 03 '19 at 00:35
6

In addition to other answers, you may use other tools like Gephi.

Gephi is the leading visualization and exploration software for all kinds of graphs and networks. Gephi is open-source and free.

Runs on Windows, Mac OS X and Linux.

Christophe Roussy
  • 16,299
  • 4
  • 85
  • 85
4

I found dot with the default -Kneato too slow on my large graph (svg). I ended up using

dot -Ksfdp -ooutput.svg -Tsvg input.dot

where input.dot was

digraph {
    graph [overlap=false];
    a -> {b c d e f g}
    b -> {c e g x f}
    ...
}
jnnnnn
  • 3,889
  • 32
  • 37